An interesting problem that I perceive exists in selecting a fixed income instrument is whether or not it makes sense to wait for a better instrument some time in the future. For instance, if interest rates are likely to go up, and some new certificates of deposit with better rates are likely to become available within x number of days – should you wait for them? Or should you invest in one now in order to start getting interest on your investment as soon as possible. Of course the answer is that it depends.
What does it depend on? It seems to me that it depends on:
- the instrument currently available and its return
- the forecast of interest rates and the confidence you assign to those forecasts (Alternatively: the future instruments likely return)
- your current level of apathy towards life
- the time between potential investments
I’ll quantify this problem by looking at current and expected APY of instruments and reviewing the number of days of delay that would still result in breaking even at the payout of the first instrument. Visually:

It is interesting to compare the % increase in value of each instrument at the evaluation point. Of course, investing in instrument 2 represents some opportunity cost due to finances being tied up in instrument 2 further into the future than instrument 1. I find it appropriate to leave this area out of the evaluation. The justification being it is unknown if available rates will be better or worse than the instrument 2 rate when instrument 1 investment becomes liquid again.
Below is a plot that visualizes acceptable days of delay. On the y axis is the number of days delayed between investments. The x axis shows the APY of instrument 1. The colored lines represent the maximum time delay in order to break even with instrument 1 given an investment in instrument 2 with an APY corresponding to instrument 1 API + X% according to the legend.
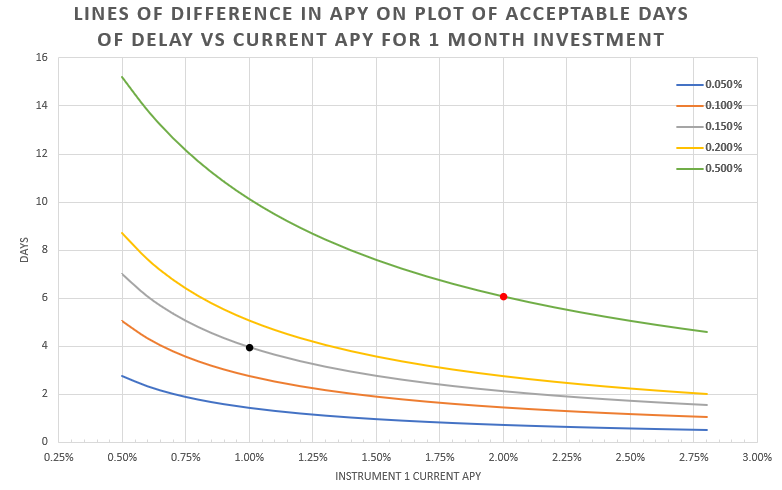
The red dot shows that if instrument 1 has an APY of 2%, a delay of just over 6 days is acceptable to wait for an instrument with a 2.5% APY. The black dot shows that if instrument 1 has an APY of 1%, a delay of 4 days is acceptable to wait for an instrument with a 1.15% APY. Any delay longer than the plot’s functions represents a loss when investing in instrument 2, and any delay shorter represents a gain.
Looking at the same information for 1 year investments:
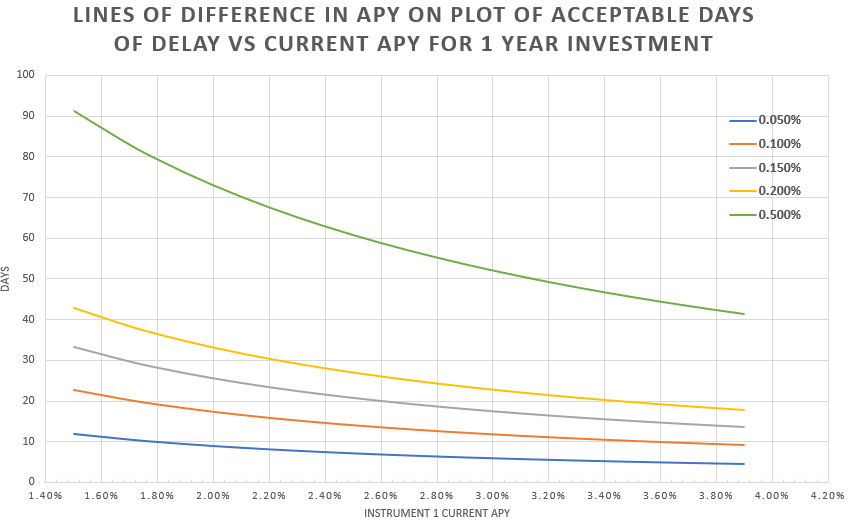
It was interesting to me that as the instrument 1 returns go up, the acceptable delay goes down, even for the same % increase in returns. It makes sense intuitively with a little extra thought that the increase is proportionally smaller.
A less exciting visualization can be done for a difference between two specific investments at a given delay. A plot of return difference versus days of delay helps to quantify the loss or gain associated with choosing a delayed instrument (instrument 2) over a currently available one.
In this case, the plot shows the difference between a 3% instrument and a 3.25% instrument with colored lines representing duration of both instruments. The black dot represents the point where a 3.25% APY year long instrument would return .2% more than a 3% instrument after a delay of 6 days.

There are lots of variables associated with fixed % investments. Some advertise simple interest, some APY, some APR. Each means a different thing and the investments need to be understood in order to apply a comparison accurately. Fortunately Investopedia and other sites have lots of good information to describe these terms. Digging them out of the institutions that offer the instruments can be a challenge.
I have placed a calculator for comparing two instruments with different APY’s that returns break even delays for standard length term investments (1mo,3mo,6mo,1yr,3yr,5yr,10yr) on the Wool Socks GitHub.