I have fantasized that someday I would fly a little bush plane out of a little private grass strip I maintained. While this may never happen, in the event that it does, I should be prepared to know whether a location is suitable and how to ideally place the runway.  My (limited) perspective in this domain is that the driving factors in selecting a runway heading for small VFR aircraft would be:
- Local geography
- Wind speed
- Wind direction
- Frequency of wind speed & direction combination
The general location could be evaluated by understanding things like:
- frequency of poor visibility
- rate of change of inclement weather
- air temperature and humidity
- sky cover and clouds
- etc.
There is a bit of nuance to selecting something like the direction a runway should face. I would want to understand if the wind is extremely strong out of the south but very rarely. If it almost always comes from the northwest. If it has some common shifts during the day. If it has seasonality. If it is gusty and frequently comes from the west, but only when it is raining.
While I do not yet have a plot of land, or a weather station to make measurements in order to analyze data, I can simulate such a situation. NOAA holds a bunch of data taken from weather stations all over the United States. Data from 2010 for a bunch of hourly parameters is free from here.
I arbitrarily chose the following location and selected all the data available at the station:
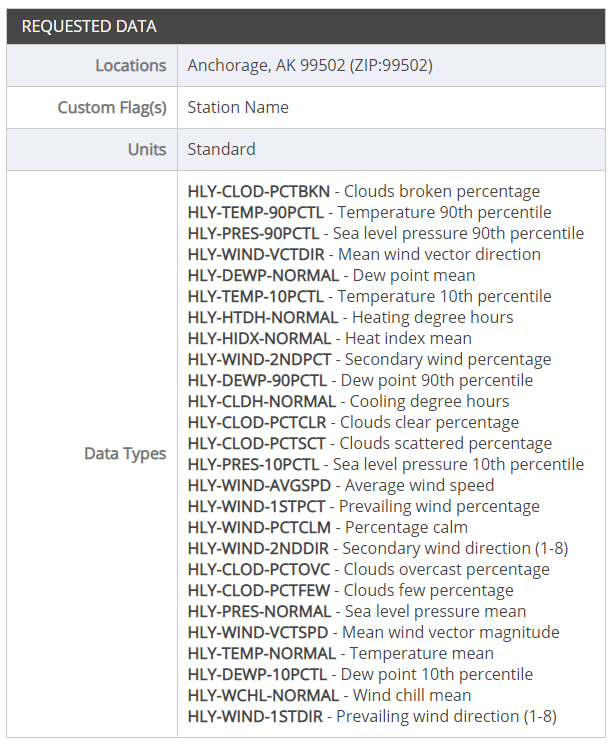
Looks like a decent amount of data that is relevant for understanding whether a location is suitable for placing a runway, and selecting a direction for the runway to face. As an aside, the way that you get this data from NOAA is kind of fun, you put it in your shopping cart and “checkout” then receive a nice email synopsis of your order with a download link.
They can send the data as a .csv file which is convenient, as this particular file is not too large (2MB) to crack open and peek at in excel. It is also easy enough to open up in pretty much any language I would use for analyzing the data (R, Python).
Python has a convenient package called ProfileReport that prints out a convenient synopsis of summary statistics. A portion of the output:
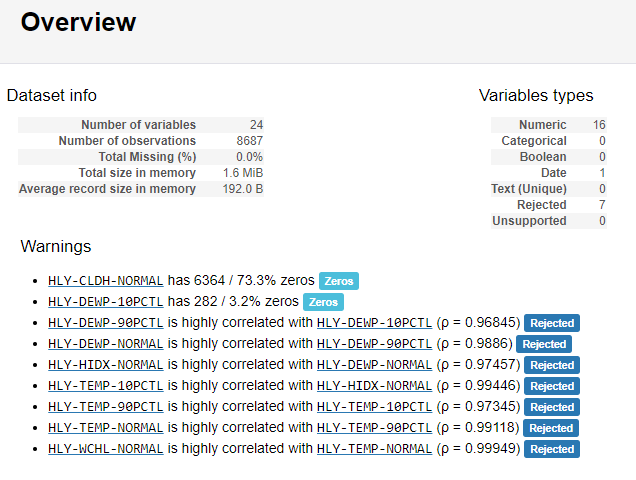
There is sometimes a ton of effort that needs to be put into data cleaning. In this case, I was very lucky and had to do very little. I reformatted the date, and set it to a datetime object. Removed pressure data for lack of variance and set the index (row identifiers) to the datetime object column. This post is about runways, not data cleaning. The wool socks github will contain the Jupyter Notebook associated with this post that will have code details.
Wind
Here is a polar plot of winds measured at Ted Stevens in Anchorage. Where radius is the mean wind vector magnitude and the angle is the wind direction. The data points are translucent so that some sense of frequency of each measurement is retained.
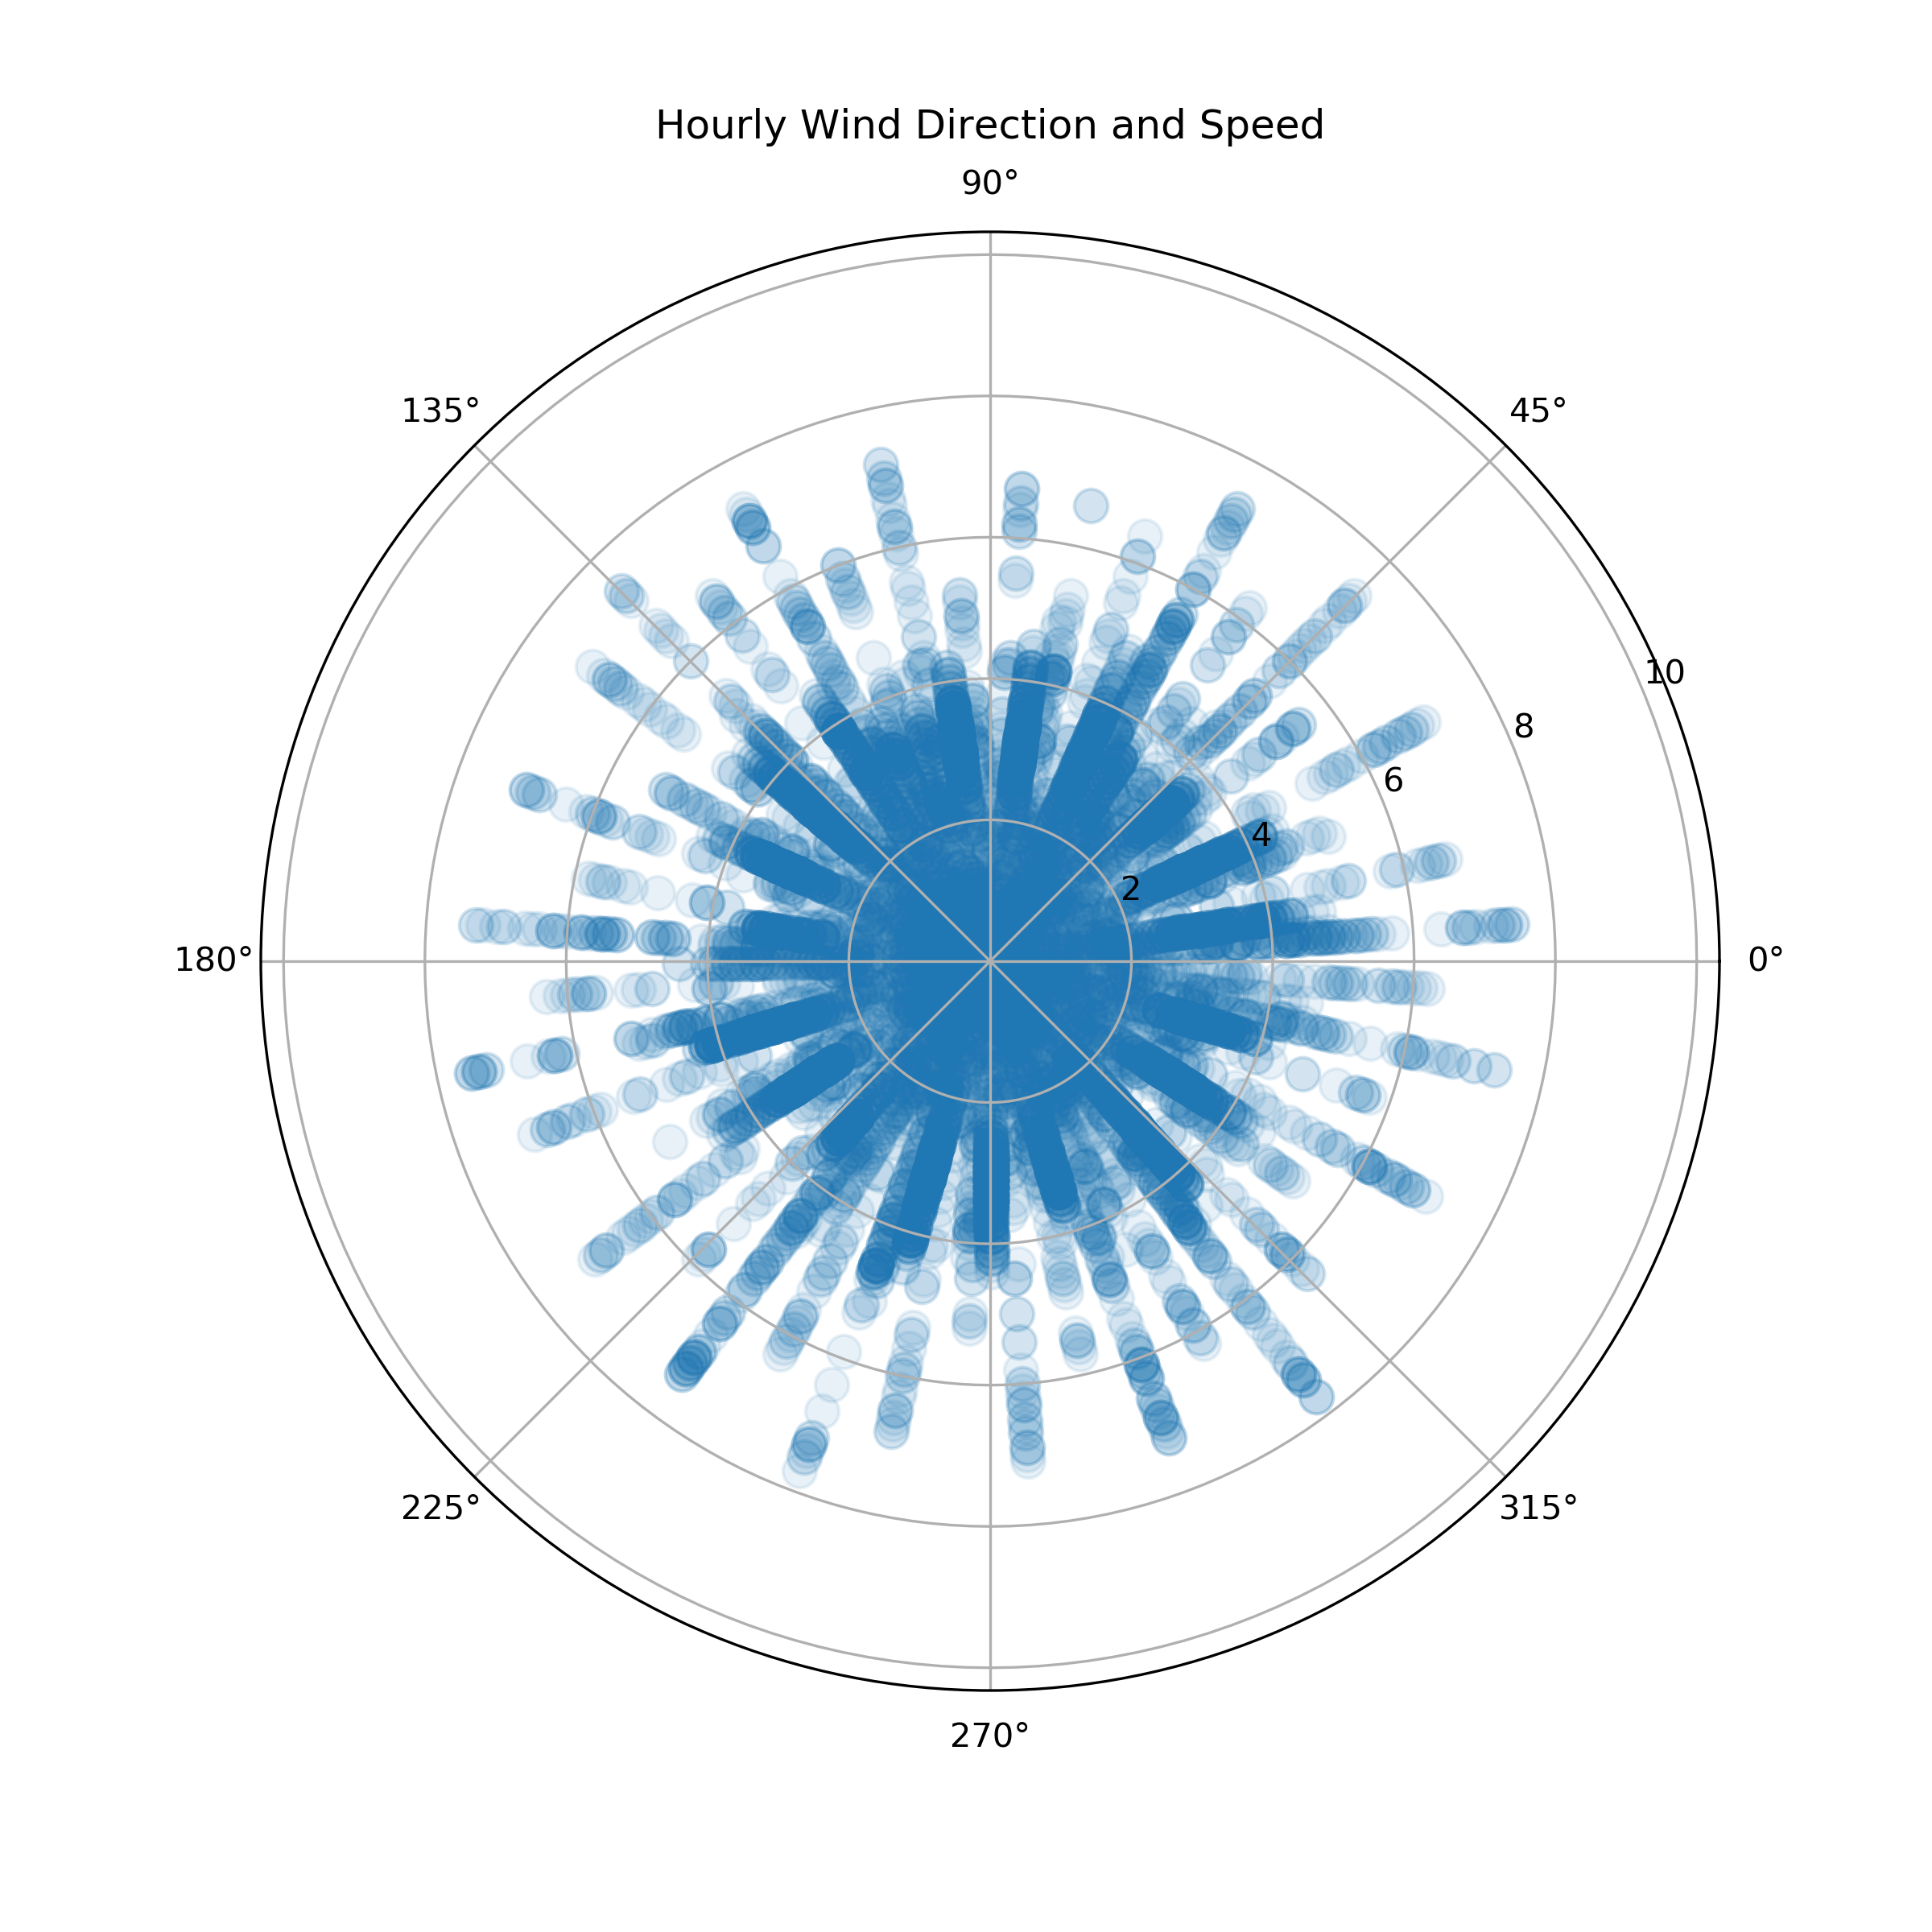
That’s not super helpful. Ideally there would be some frequent strong winds to align the runway with. Fortunately the “mean wind vector magnitude” doesn’t appear to get over 8 mph. I don’t know how that column is generated, I would be interested to understand how it differs from “wind average speed”. While looking at this plot I thought it might be a good idea to reduce the data to only daytime winds since I fly during the day when there are interesting things to see outside and I am less likely to die in an engine out scenario.
Here is the polar plot of only daytime winds (it would be great to filter by the sunrise and sunset of each day across the year. I will be lazy and take 10am to 6pm across the whole year as ‘daytime’).
Still not much to go on here. Suffice to say that with a maximum of 8 mph hourly average winds in any direction, pretty much any runway heading will be fine.
Cloud Cover
I figure it makes sense to run the rest of the analyses on the daytime data only (9AM to 6PM). Below is a plot of cloud coverage broken into the categories of Overcast, Broken, Scattered, Few, and Clear. This is an ordinal list from worst case to best case scenario for VFR flight. Here’s a plot of the cloud cover situation in Anchorage:

Generally, scattered, few, and clear is fine for any altitude. This dataset doesn’t contain cloud layer altitude so that’s sort of a pain, I don’t really care if it is overcast but the layer is 5000 feet above the ground. Anyway, that makes this a conservative assessment of the site. Looking at this plot, it seems that Anchorage is usually mostly overcast. Fortunately, the cloud cover appears pretty consistent year round, rapid changes in cloud cover are not detectable looking at this plot.
Dew Point & Relative Humidity
If the dew point is close to ambient temperature (high relative humidity), the air does not have to be cooled much for water vapor to condense and become liquid water. This is a problem for engines with carburetors or any intake system with a venturi and throttle valve. The issue is that the temperature of the air drops in the venturi as the air accelerates through the restriction. This causes water to condense on the walls of the intake and the throttle plate. This water can freeze and cause ice to form. If enough ice forms, air can no longer pass through the venture and the engine cannot run. This is a potential issue for pretty much every general aviation aircraft. So an ideal site for a operating a GA airplane might have a large delta between the dew point and the temperature, or a low relative humidity for much of the year. Taking a look at temperature and dew point:
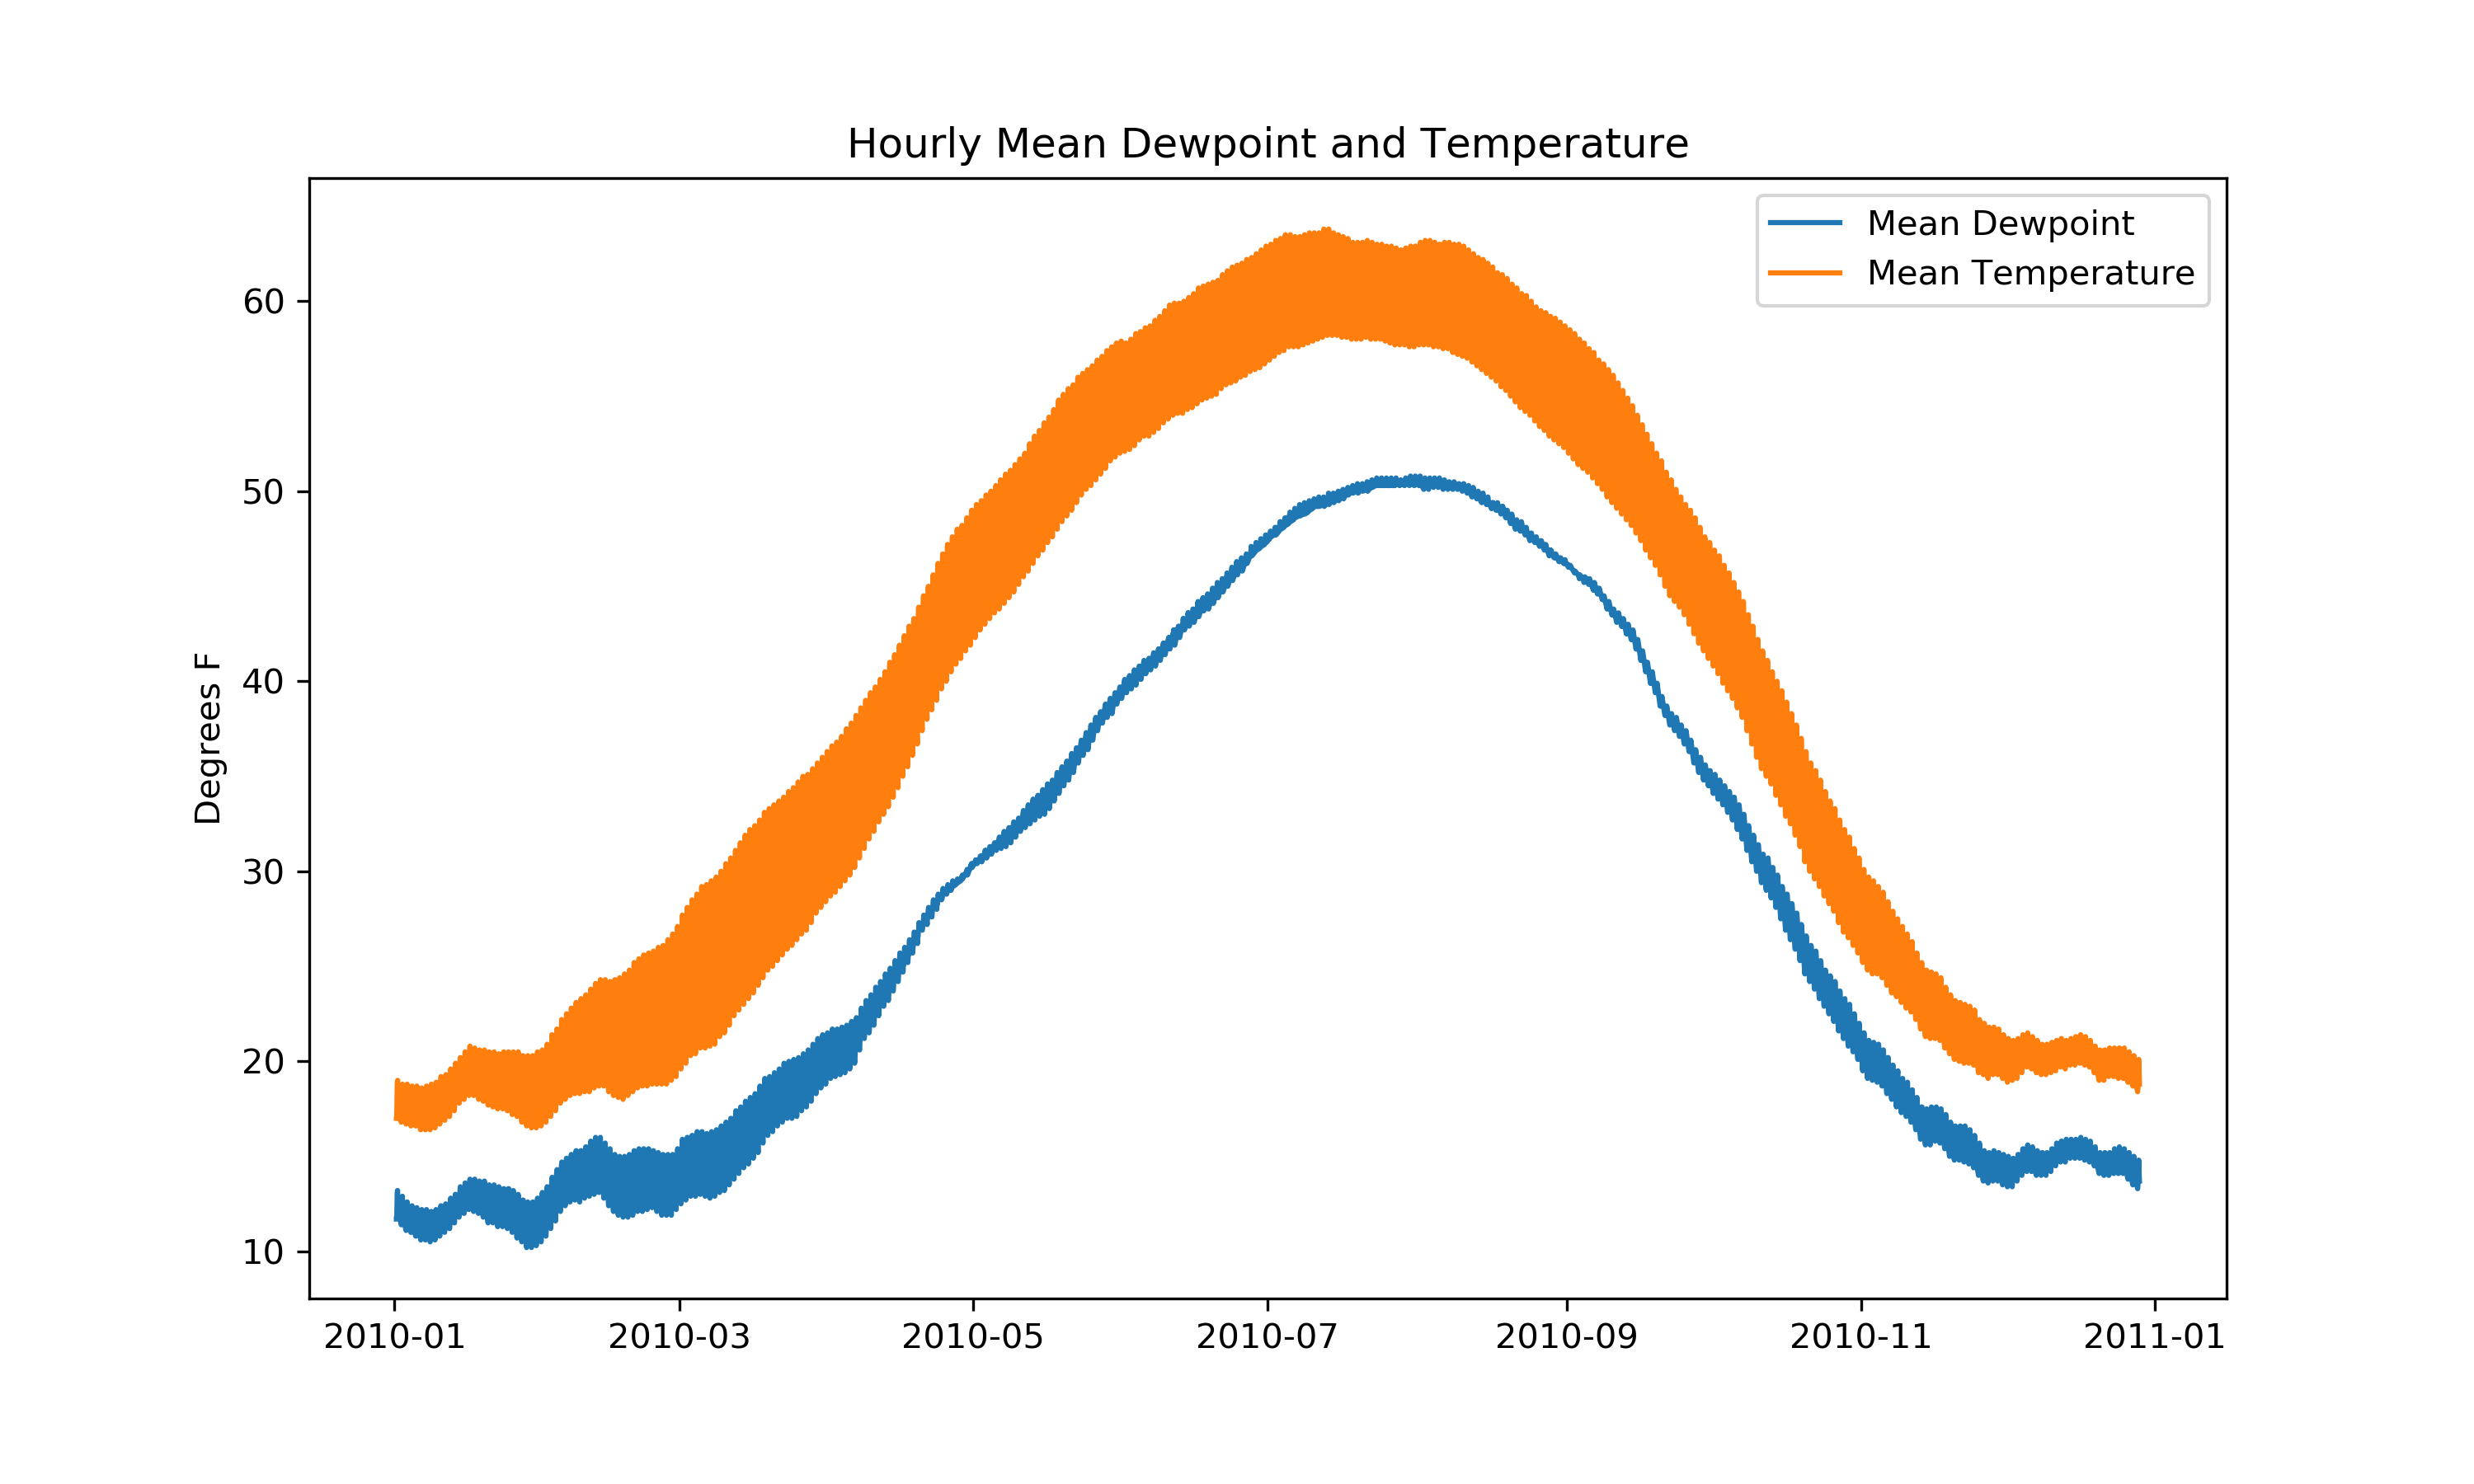
Unfortunately this dataset does not contain a relative humidity measurement, but it can be approximated with temperature and dew point using the following equation:
$$RH=100-\frac{25}{9}(T-T_{dp})$$
Where RH is relative humidity, T is outside air temperature, and T sub dp is the dew point. Taking a look at relative humidity over the year:
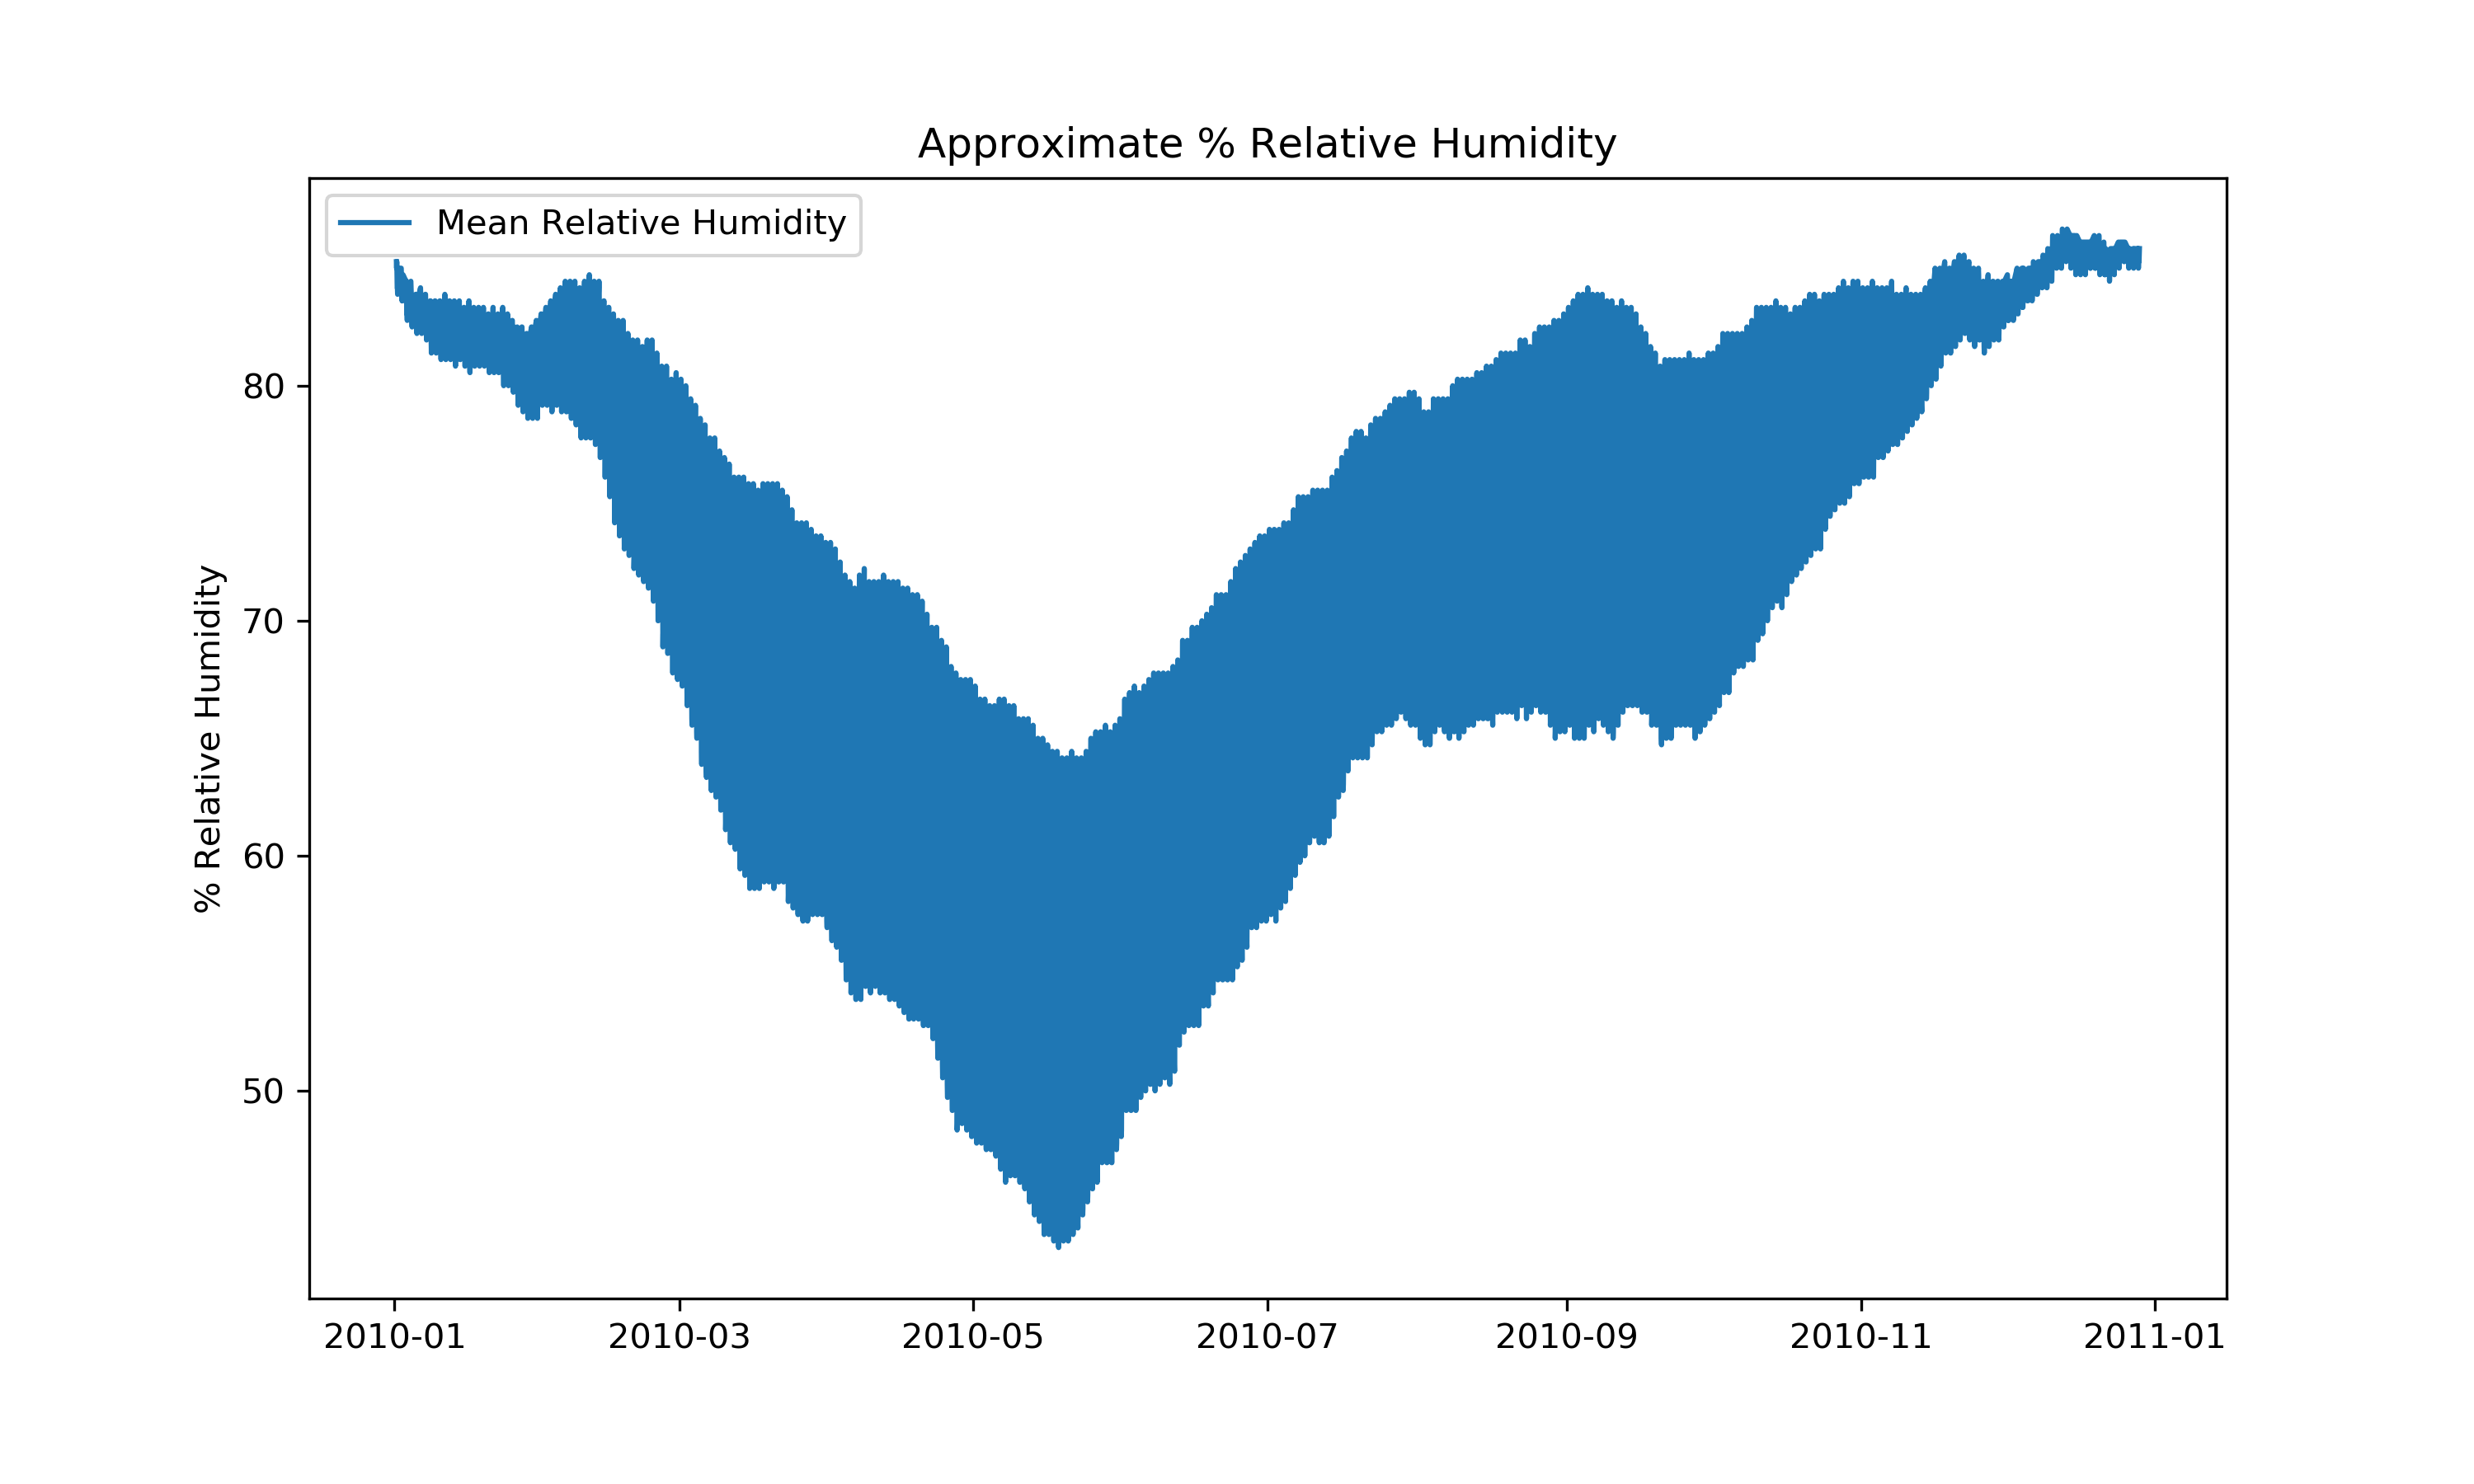
It appears that % RH remains moderately high throughout much of the year in Anchorage. Which makes it somewhat worse than say Phoenix, AZ from the perspective of icing risk.
Closing
Qualitatively, Anchorage doesn’t appear to be the best place from a visibility perspective, with regard to wind, any runway heading will check out. In the real world, it would be a good idea to set up a weather station at the site you plan to use. Local geography could have a large impact on weather that affects runway location and heading selection.
This analysis can be run on any hourly averages dataset pulled from NOAA. I have placed a jupyter notebook on the wool socks github here. All one needs to do is change where the notebook looks for the csv.