Introduction
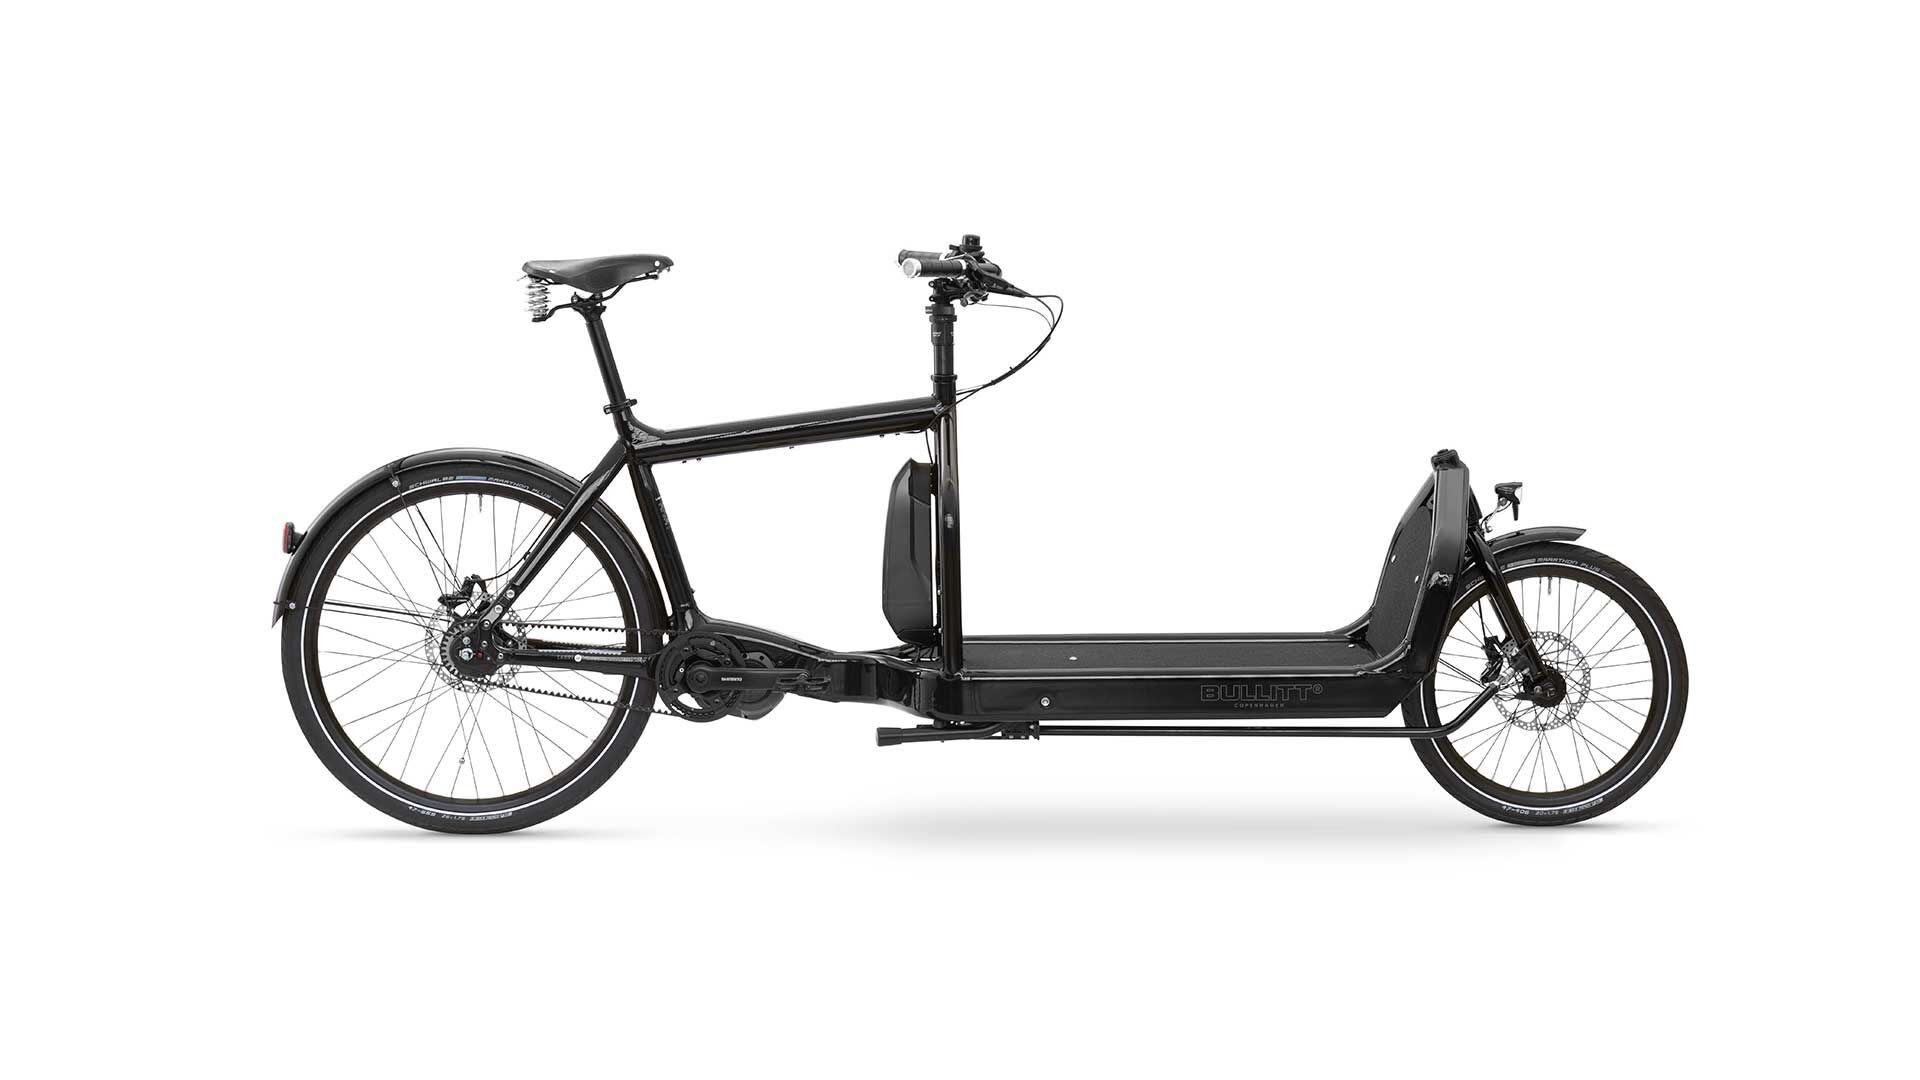
In my last post I looked at the practicality of a human powered cargo bike. The short of it is that it’ll work okay if you live where its flat, and you don’t mind going slow. If you want to feel the wind in your hair and climb hills with ease, you’ll want to go the electric route. There are many choices to make if you decide to go electric. In this post I’ll compare a production electric bike and a DIY system built on top of the same underlying bicycle frameset, the LvH Bullit.
How to Compare?
Here are some characteristics of an ebike that I think matter:
- Range
- Climbing Capability
- Regenerative Braking
- Top Speed
- Pedal Assist
- Cost
Range
Assuming system-efficiencies are comparable, range of an ebike is determined by the energy capacity of the battery, measured in watt hours. Commercially available batteries for ebikes range from around 300 watt hours to 1,000 watt hours. The production eBullit comes with a 630 watt-hour battery pack with a nominal voltage of 36V. This battery costs around $700. A DIY-centric ebike battery from a reputable source below the $700 price point is the EM3ev jumbo shark which provides 17 amp-hours at 52V giving 884 watt-hours. So the DIY approach yields 40% more range, again assuming comparable system efficiencies. A win for the DIY approach.
Climbing Capability
The climbing capability of a motor is largely governed by its power output at low wheel speeds. As grade increases, the power required to climb increases:
$$ P_s = \frac{vmgs}{1+s^2}-\frac{1}{2}$$
Where \(P_s\) is power to climb a slope, \(v\) is velocity, \(m\) is mass \(g\) is acceleration due to gravity, and \(s\) is road slope.
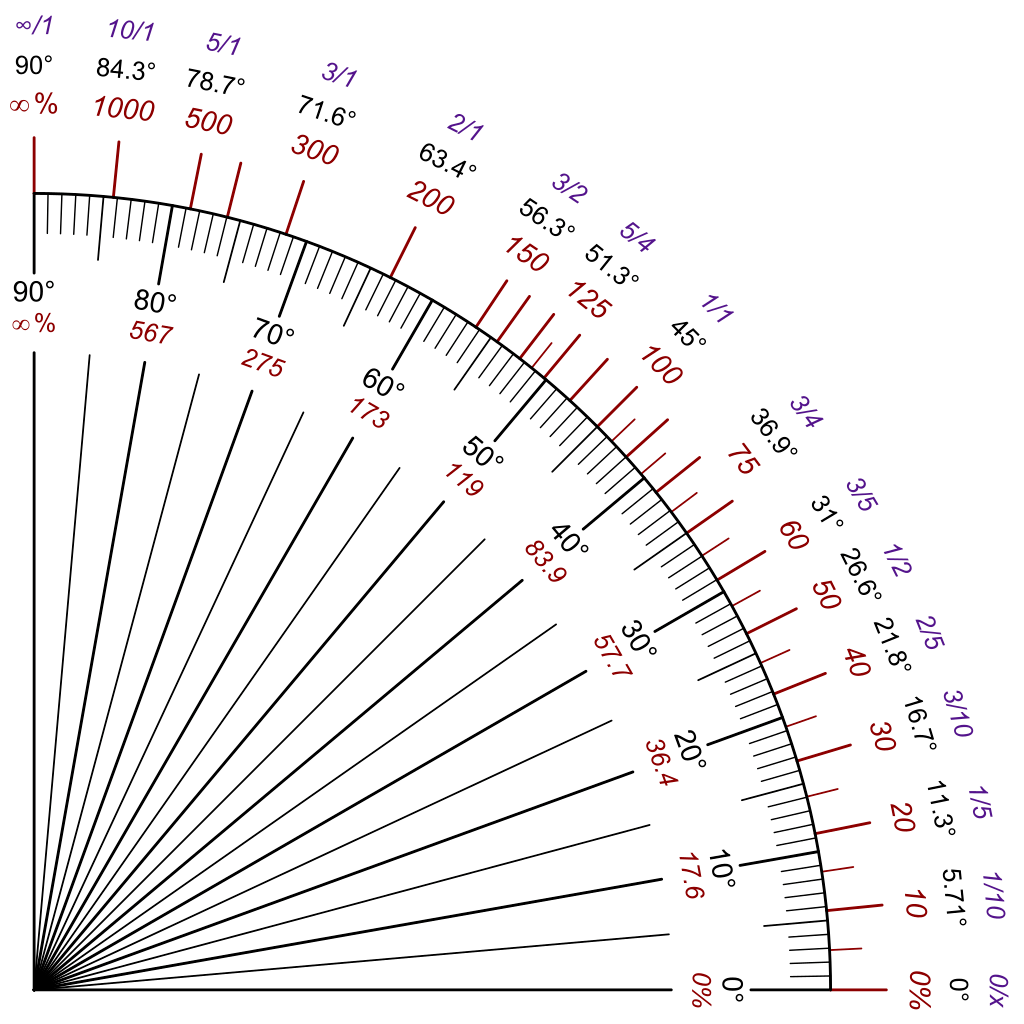
The vast majority of road slopes \(s\) are below 10% or .1, but a few exceed 30%, see the red numbers on the plot below:
The power required to climb at 10mph on the bullit cargo bike visually:
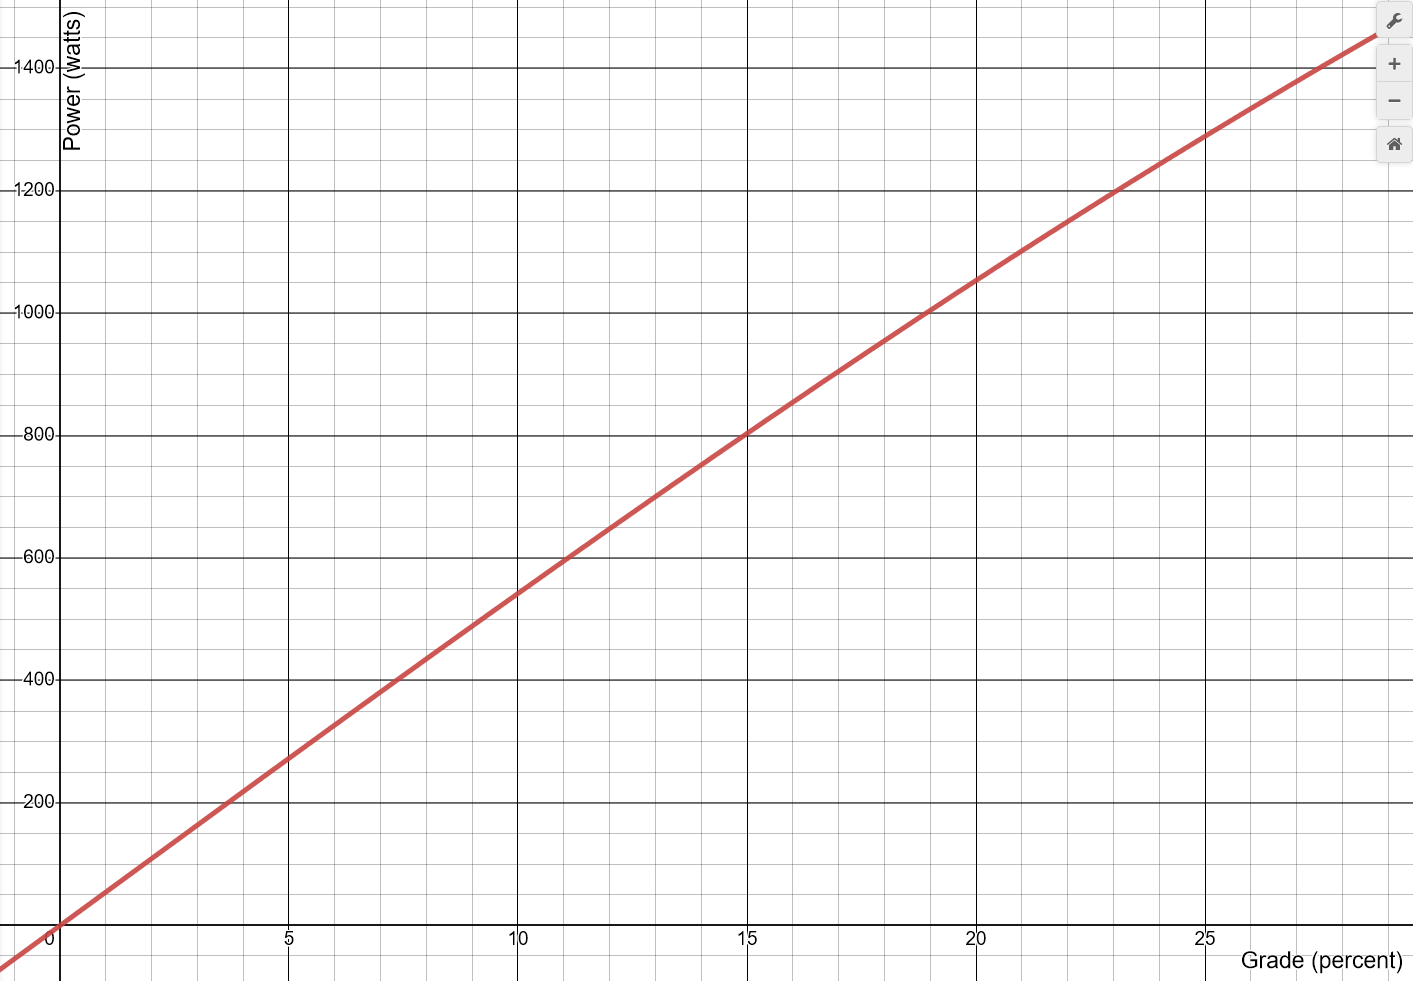
The actual power required is higher – because of aerodynamic drag and rolling resistance, but I think the effects of those can be ignored for the purpose of comparing climbing capability. To make the problem simpler still, I think climbing capability can be evaluated by answering the following question:
“What is the maximum grade that a 125kg bike+rider can ascend at 10mph on motor power alone?”
DIY Build Climbing
To answer this question for a DIY bike, I’ll use the motor simulator provided by grin technologies. To use the motor simulator, I have to make a bunch of selections, like a motor, battery nominal voltage and amp-hours, controller, wheel size, and bike+rider mass. Fortunately, I have a DIY system in mind and I have selected the appropriate system and vehicle parameters so that I can answer the above climbing capability question.
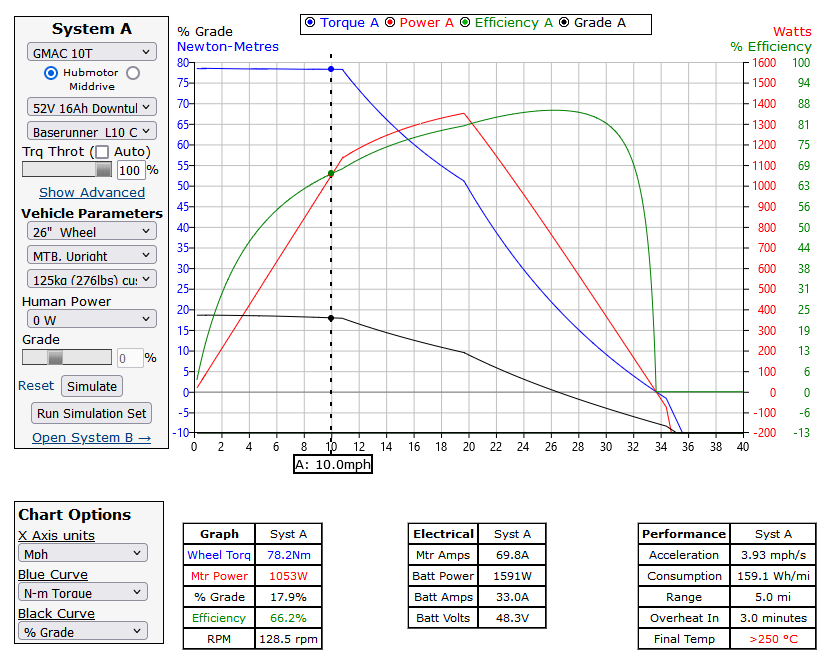
There is a lot to unpack with the above plot, and it’s best explained by the makers of the simulator. For the purpose of this exercise, the important thing to note is that at 10mph on the x axis, at maximum throttle the motor can push the DIY bullit build up a 17.9% grade.
Production Model Climbing
Evaluating the ability of the production bullit’s ability to climb is more challenging than the DIY build. I am not aware of current limits from the controller or the appropriate gearing choice to maximize output power at 10mph. The motor is capable of outputting a maximum of 85 newton-meters of torque. Because of the mid-drive setup, I will assume there is some gearing selection that allows for all 85 newton-meters of motor torque to translate into wheel torque at 10mph. Then the output power of the production model is 85 * \(\omega\). Where \(\omega\) is angular velocity. The angular velocity of the wheel at 10mph is:
$$ \omega = \frac{v}{r} =\frac{10 * 0.44704}{0.3302} = 13.54$$
Where \(v\) is velocity and \(r\) is wheel radius. This makes the output power 85 * 13.54 = 1151 watts.
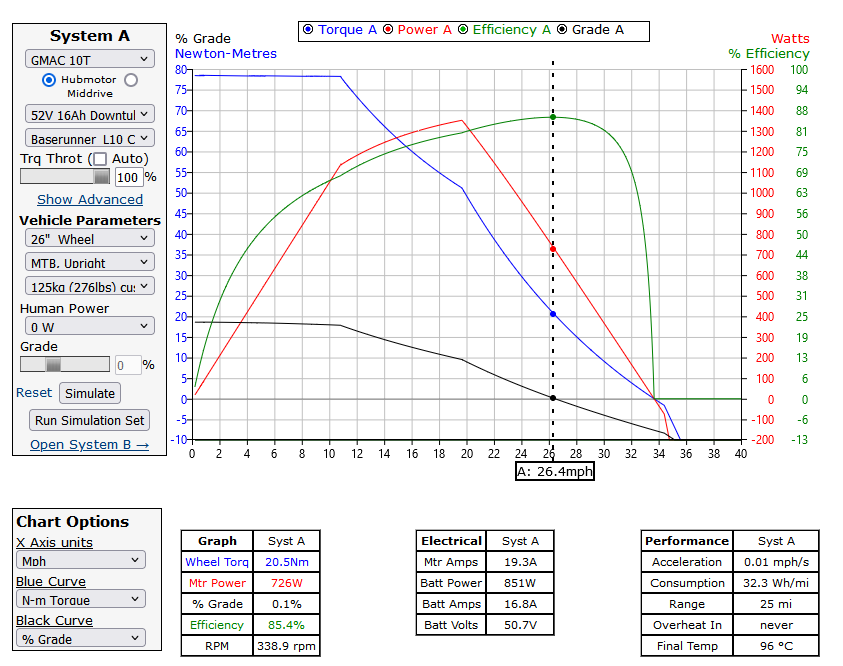
Fortunately, I can still take advantage of the motor simulator and show the % grade that results in a steady state climb given 85Nm of wheel torque:
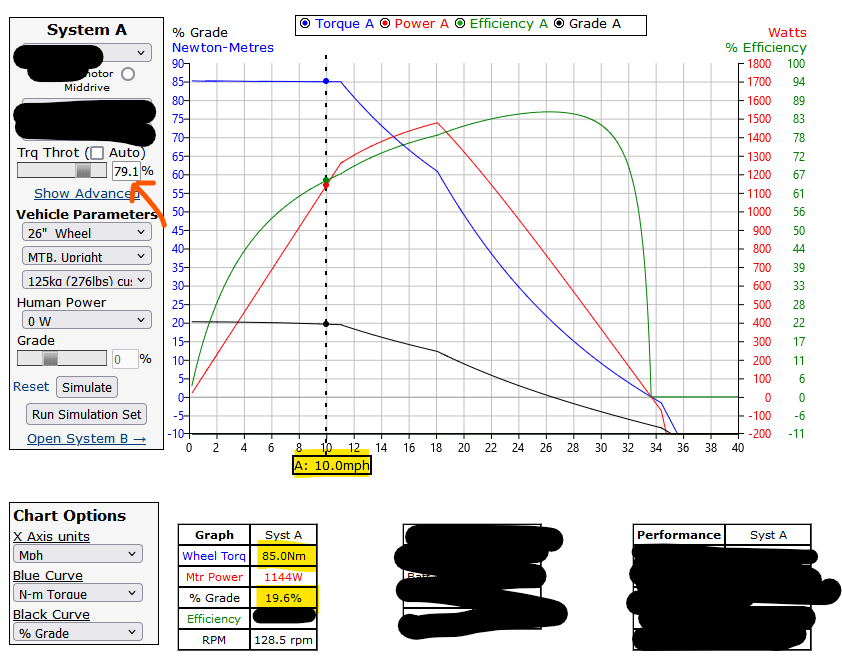
I have expunged information about the system that does not reflect the production system. I have adjusted the throttle setting (red arrow) to set the wheel torque to 85Nm at 10mph. This allows a comparison between % grades climbed by the production system to that of the DIY system.
Whether or not all of that sunk in, the short of it is the production system has more chutzpah in hill climbing. The production system can climb a 19.6% grade and the DIY ebike system can climb a 17.9% grade. Both of these are acceptable, as I rarely encounter grades over 15% on streets. Still, this is a win for the production model.
Notes on Climbing Capability
I made an assumption in the production system analysis that the 85Nm of maximum torque published by the motor manufacturer translates into max wheel torque at 10mph, even if the motor is 85% efficient in turning electrical power into mechanical power at the wheel, the 1144 watts of mechanical power required to propel the rider at 10mph up a 19.6% grade would require about 40 amps of current (given the 36V battery), which might be over the maximum current limit of the controller.
The DIY ebike’s climbing capability could be improved by selecting a controller with a higher max current limit. In the analysis above, I chose the Baserunner L10 controller, but a Phaserunner L10 controller would allow for greater climbing capability than the production model:
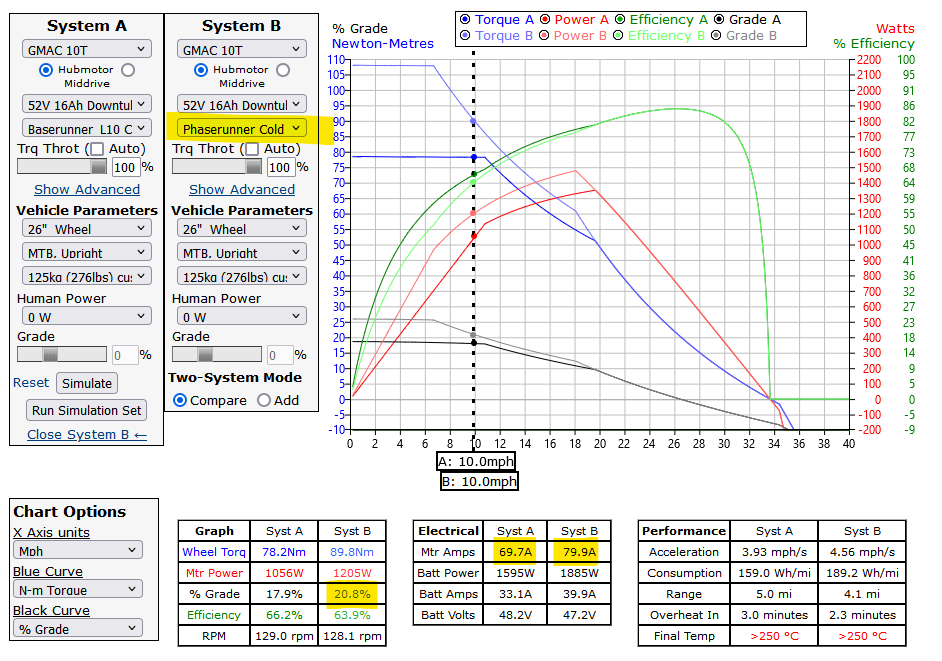
So why not just pick the Phaserunner instead of the Baserunner for the DIY solution? The negatives of the Phaserunner are that it is more expensive, a larger form factor, and the increased capability is likely not necessary in the vast majority of expected riding conditions.
Regenerative Braking
The production model is not capable of regenerative braking. The primary reason is the mid-drive motor is connected to the wheel via a freewheel. This means that there is no way for the rotating rear wheel to drive the motor as a generator. Even if you did set up the production model on a fixed gear to eliminate the freewheel, the unacceptable operational consequences would be a very narrow range of speeds for which the bicycle is comfortable to pedal.
The DIY build is capable of regenerative braking despite using a geared-hub motor. The motor clutch is locked to facilitate regenerative braking. The negative consequence of the locked clutch is an increase in rolling resistance. The DIY build also incorporates a sophisticated device allowing the user to program how regenerative braking should be incorporated into their rides. This is an obvious win for the DIY approach.
Regardless of the prospect of putting energy back into the battery while riding, a benefit of regenerative braking is the minimization of brake wear. The “prospect of putting energy back into the battery” is an interesting topic so I’ll touch on it.
Notes on Regenerative Braking
In my mind regenerative braking is a great way to convert energy that would typically be used to push air around into energy that can be stored in your battery pack for later use. If I approach a long steep downhill on a bicycle, I typically pedal until I reach a certain speed, then coast, then maybe tuck my body into a more aerodynamic shape. This makes sense, because as your speed increases, the value of being more aerodynamic increases, and the extra speed you get for pedaling decreases.
$$ P_D = \frac{1}{2}\rho v^3 A C_D $$
In English: the power to overcome aerodynamic drag is equal to one half the air density times velocity cubed times frontal area times drag coefficient.
Here is a plot of the relationship between power it takes to push air around Y, and speed X:
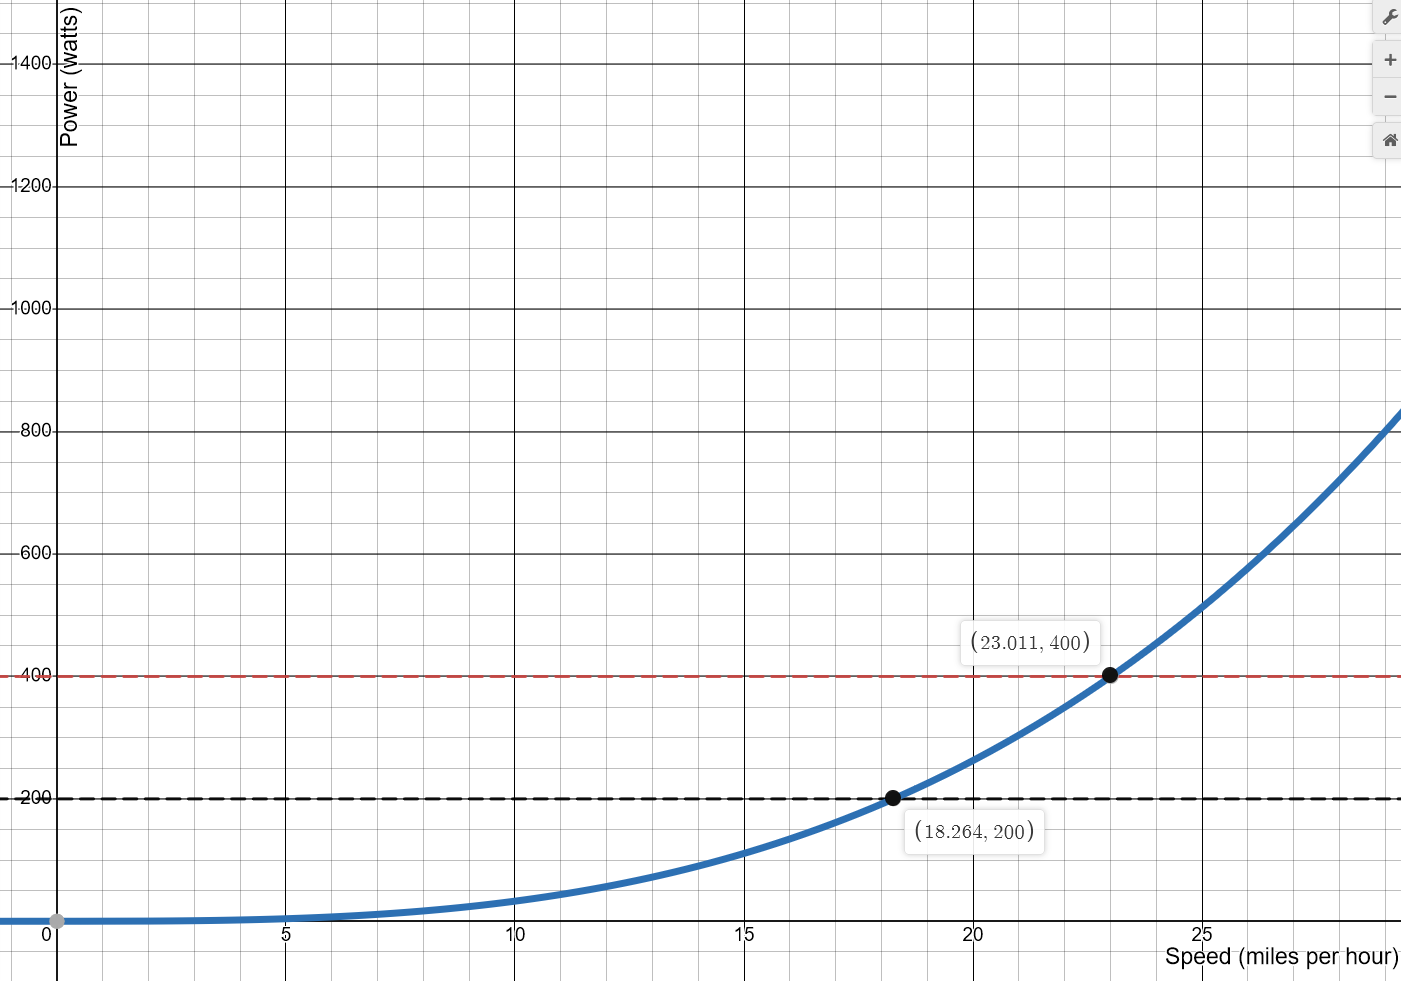
at 18 mph, it takes 200w of power to push air, at 23 mph, it takes 400w. If you can get into a more aerodynamic position, you can flatten the curve out. For me on a cargo bike – aerodynamics really start to matter starting around 20mph. Its not uncommon to reach speeds in excess of 30mph in hilly areas. But what does this have to do with regenerative braking?
On a manual bicycle, there is no point in slowing down on a steep descent, because you cannot use the energy you might save by going slower, but on an ebike with regenerative braking capability you can.
On any given slope, there is an associated steady state velocity given a bunch of fixed parameters. I showed this equation on my last post:
$$ p = \frac{v(\frac{1}{2}\rho v_w^2 S C_D+mgsin(arctan(s))+mgC_R+ma)}{\eta} $$
Which relates power required to velocity multiplied by the forces acting on the bicycle when acceleration is equal to 0. I’ll fill in all the values that are fixed:
$$ p = \frac{v(\frac{1}{2}1.225v^2 0.6 +125(9.81)sin(arctan(s))+125(9.81).007)}{.96} $$
This leaves power \(p\), slope \(s\) and velocity \(v\) free, which can be visualized with a 3d plot:
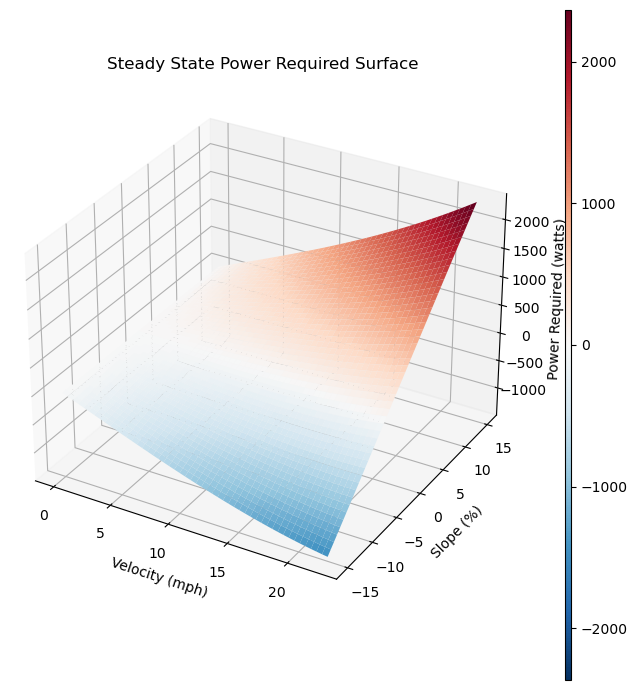
I added color to the power required dimension to help visualize which combinations of slope and velocity require what amount of power. There are some combinations of slope and velocity that result in a negative power required*. A negative power required means at that condition, the bike will accelerate, towards a steady state velocity for which power required = 0. Correspondingly, when power required is greater than 0, the rider or motor have to put in that amount of power in order to prevent deceleration. Here is a closer look at some steep negative slopes to show areas with negative (blue) power required:
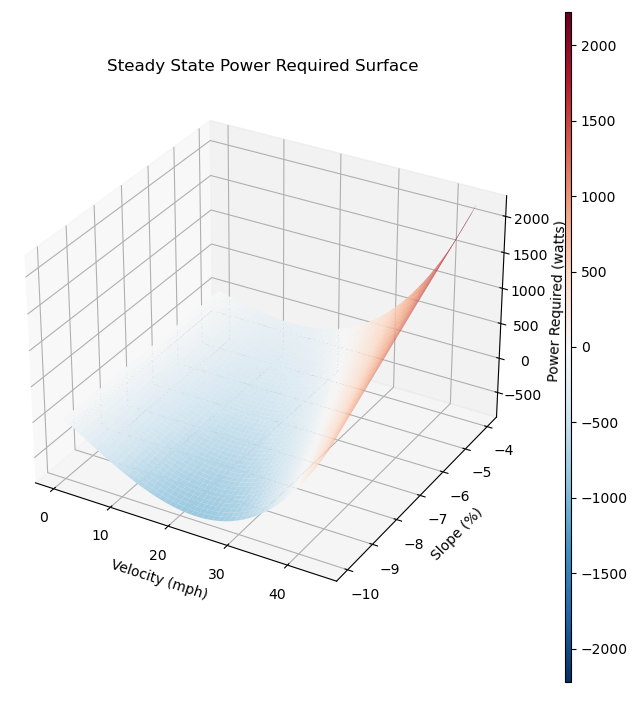
White areas on the surface represent the steady state condition on a given slope. As the downhill slope gets steeper, the steady state velocity increases. So what does this have to do with regenerative braking?
Anywhere the plot above is blue, there is potential to take advantage of regenerative braking. Why? “Negative power required” is synonymous with acceleration towards the steady state condition at a given slope:
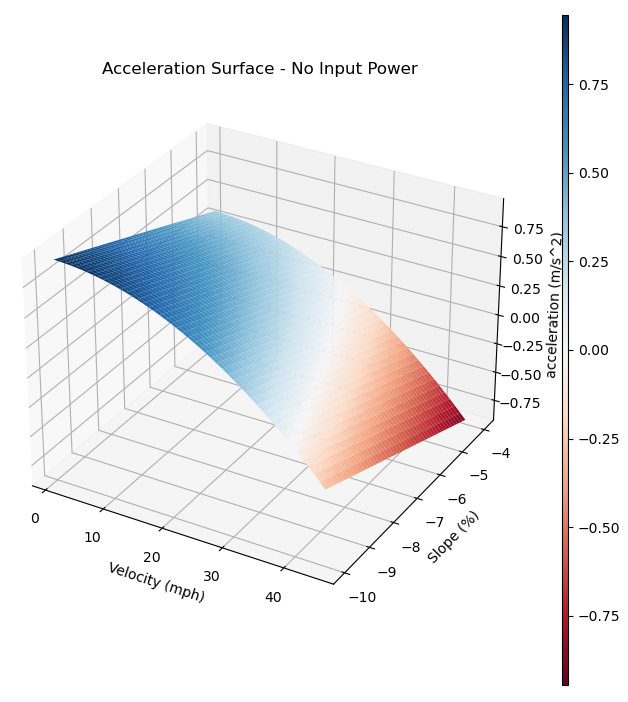
This means that energy that would typically be used to accelerate, pushing more and more air around, can instead be used to put electrical energy back in the battery.
But I want to get to my destination fast I hear you saying… how does regenerative braking help with that? Given the relationship between aerodynamic drag and velocity, along with the fixed amount of energy available in a battery pack:
The fastest way to get to point A from point B is to do it at a constant speed. If you exceed your average speed, you are “wasting” energy to push more air around than you need to, and if you go slower, you have to go faster at some other point in time to make up the difference.
I’ll put that in my bicycling art of war. Despite the complicated optimization to understand how much regenerative braking to do, and when, its a worthwhile capability to have.
Top Speed
I’ll evaluate “top speed” under the following conditions:
- Flat road
- No headwind
- No assistance from the rider
That reduces the power required equation to the following:
$$ p = \frac{v(\frac{1}{2}1.225(0.6)v^2 +125(9.81).007)}{.96} $$
So which system can put out the most \(p\)?
Like for the climbing evaluation, I don’t know the current limitations for the production ebike system. I do know that the production model is a class 1 ebike – which means it will provide pedal assistance up to 20mph, so its top speed is… 20mph. If speed information comes from something like a hall effect sensor on the rear wheel it may not be difficult to program in a smaller wheel size or find another hack to remove the assist-speed limitation.
The DIY build looks like the following under max throttle and no human power:
The DIY build tops out at about 26mph. Neither system is particularly compelling from a top speed perspective. The DIY build will at least keep providing assistance in a tailwind, or when the rider pedals hard faster than 26mph.
Pedal Assist
both systems incorporate pedal assistance so that the rider doesn’t have to hold onto the throttle all of the time. Class 1 ebikes have no throttle so the only way to get any sauce out of the thing is to provide some sauce yourself.
There are different ways to get the bike to “know” you are pedaling, the cheap way is a ring of magnets that detect the pedal cranks passing, and provide a level of assistance based on logic associated with that input signal. Fancier systems use a toque sensor. Both of these systems incorporate a torque sensor. Pinkies up folks. Both appear to be programmable to adjust how the motor assists based on rider input. I’ll call this a tie.
Cost
The production model I have been evaluating costs $8,000. Pinkies up indeed.
The DIY cost breakdown is as follows:
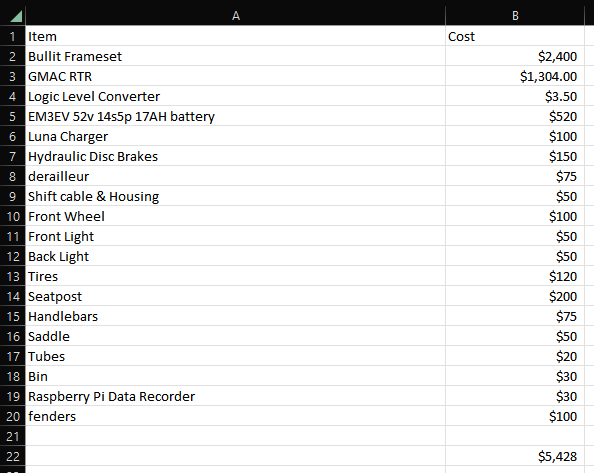
I did some rough approximations for some of the prices – suffice to say the DIY approach has some breathing room. Around $2,500 of room. The DIY approach wins on cost.
Lets Wrap This Up
So what are the final results:
| DIY Build | Production | |
| Range | ✓ | |
| Climbing | ✓ | |
| Regenerative Braking | ✓ | |
| Pedal Assist | ✓ | ✓ |
| Top Speed | ✓ | |
| Cost | ✓ |
If I go down this road, I’m going DIY.
Notes on Notes on Regenerative Braking
Using this equation:
$$ p = \frac{v(\frac{1}{2}\rho v_w^2 S C_D+mgsin(arctan(s))+mgC_R+ma)}{\eta} $$
To compute the steady-state velocity for any combination of slope, mass, air density, headwind, frontal area, drag coefficient, and coefficient of rolling resistance is incorrect. Imagine a steep constant downhill on which a rider is not pedaling. The steady state velocity should be independent of drivetrain efficiency \(\eta\), so I believe the power equation that can solved for steady state velocity \(v\):
$$ 0 = v(\frac{1}{2}\rho v_w^2 S C_D+mgsin(arctan(s))+mgC_R) $$
The power required at a steady state should be 0. When I used the phrase “negative power required” in this post, I mean that the \(vma\) term in the power equation is non-zero, and the cyclist must be accelerating to compensate for the negative sum of other terms.