I previously looked at the amount of instantaneous power it would take to go 100 mph in the worlds best faired-recumbent bicycle (velomobile). It takes approximately 1,000 watts, an achievable power output for a fit cyclist. So why hasn’t anyone gone 100 mph yet? The answer appears to be acceleration.
Power Again
Previously I noted it takes power to go fast here on Earth.
On a bicycle like Eta you have to accelerate a mass (you and the bike) to 100 mph, while friction of the tires on the road, and air on the vehicle both hold you back. I created an equation for power that looks like this:
$$P_{total} = \frac{P_{R}+P_{D}}{\eta}$$
In English: The total power to maintain a speed is given by the power to overcome rolling resistance and the power to overcome aerodynamic drag all divided by efficiency of power input to push you forward.
This ignores the power to accelerate \(P_{A}\). Power to accelerate is equal to current velocity, multiplied by mass, multiplied by the rate of acceleration:
Accounting for acceleration, total power becomes:
$$P_{total} = \frac{P_{R}+P_{D}+P_{A}}{\eta}$$
Plugging in the following equations:
$$P_{R}=vmg*C_{rr}$$
$$P_{D}=\frac{1}{2}\rho v^{3}AC_{D}$$
$$P_{A} = vma$$
The final power equation becomes:
$$P_{total} = \frac{v(mg*C_{rr}+\frac{1}{2}\rho v^{2}AC_{D}+ma)}{\eta}$$
I’ll fill in all of the static variables now for a vehicle similar to Aerovelo Eta (leaving out Coefficient of Rolling Resistance):
| Mass | \(m\) | 100 \(kg\) |
| Gravity of Earth | \(g\) | 9.81 \(\frac{m}{s^2}\) |
| Air Density | \(\rho\) | 1.07 \(\frac{kg}{m^3}\) |
| Vehicle Frontal Area | \(A\) | .4 \(m^2\) |
| Drag Coefficient | \(C_{D}\) | .04 |
| Drivetrain Efficiency | \(\eta\) | .97 |
With these plugged in:
$$P_{total} = \frac{v(100*9.81*C_{rr}+\frac{1}{2}*1.07 v^{2}*.35*.04+100*a)}{.97}$$
$$P_{total} = \frac{981C_{rr}v+.00856v^{3}+100av}{.97}$$
$$P_{total} = 1011.34C_{rr}v+.00882v^{3}+103.1av$$
The only remaining variables are acceleration \(a\), velocity \(v\), and coefficient of rolling resistance \(C_{rr}\). I kept power as a sum of the three components \(P_{R},P_{D},P_{A}\) in order.
\(C_{rr}\) is also a function of velocity. So we’ll have a brief interlude here to solve that and then get back to power. Power will then be a function solely of acceleration and velocity!
Coefficient of Rolling Resistance (an aside)
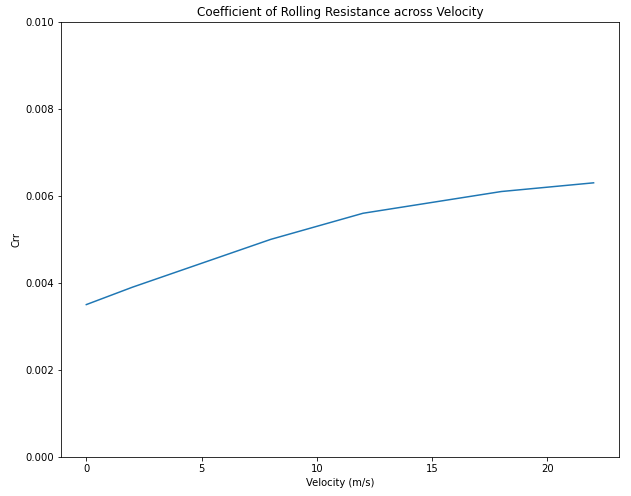
On my last post about going fast on a bicycle I shared this:

Which shows how \(C_{rr}\) increases with velocity. I want to account for this changing coefficient with velocity in my power equation, so I need to make \(C_{rr}\) a function of velocity. The trouble is, these curves do not have defined functions associated with them. I’ll need to fit a function or spline to them and extrapolate out to 100 mph.
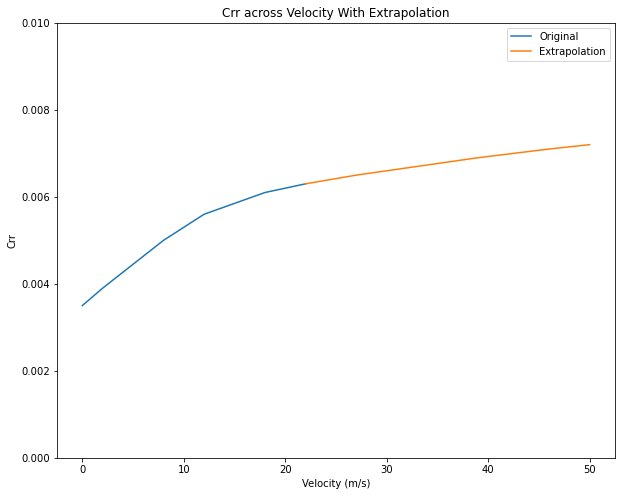
I took some points along the Schwalbe one curve and made this linear interpolation between the points:
I then extrapolated with a decreasing derivative out to 50 m/s:
Finally I fit a smooth PCHIP interpolation between all of the points. The final result:
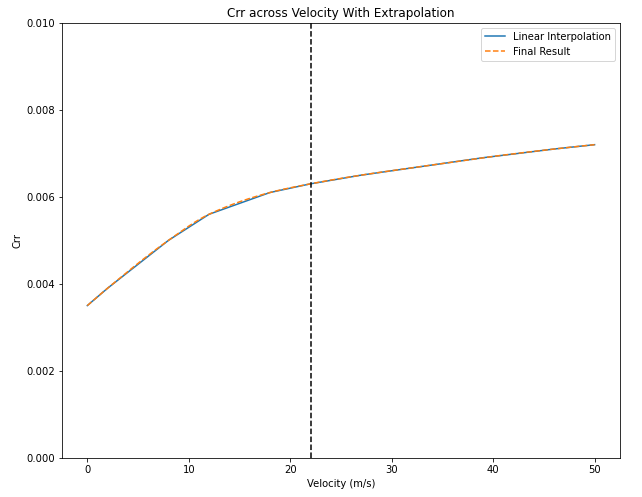
Everything to the right of the dashed black line is extrapolated. The final Crr is now defined for velocities up to 50 m/s (112 mph). Lets get back to power.
Final Power Formula (with acceleration)
I previously wrote:
$$P_{total} = 1011.34C_{rr}v+.00882v^{3}+103.1av$$
which encompasses rolling resistance, aerodynamic drag, and acceleration. Now that \(C_{rr}\) is defined as a function of only velocity, total power has become a function of only velocity and acceleration.
Solving for Power
If you are not accelerating \(a=0\) power becomes solely a function of velocity. This is a combination of aerodynamic drag and rolling resisitance:
$$P_{total} = 1011.34C_{rr}v+.00882v^{3}$$
Here is what that looks like:

The blue line intersects the world record (89.5 mph) at 845 watts.
Accelerating to 89.5 mph
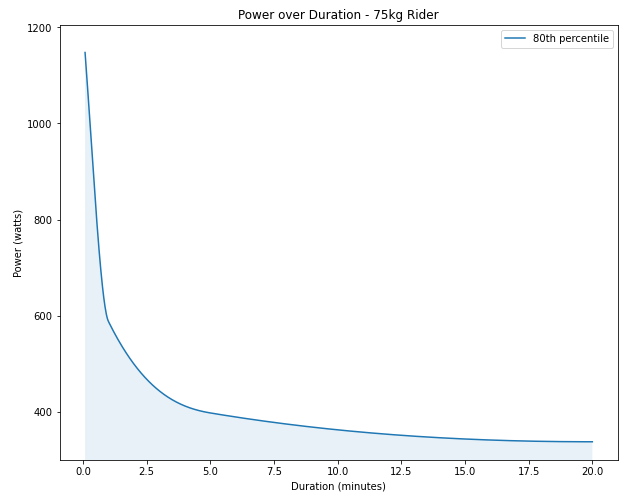
An 80th percentile male cyclist weighing 75kgs can put out 845 watts for about 28 seconds. A 95th percentile male cyclist of the same weight can do it for 38 seconds. Here are two empirically driven curves showing how much power a fresh cyclist can output over duration (on an upright bicycle).
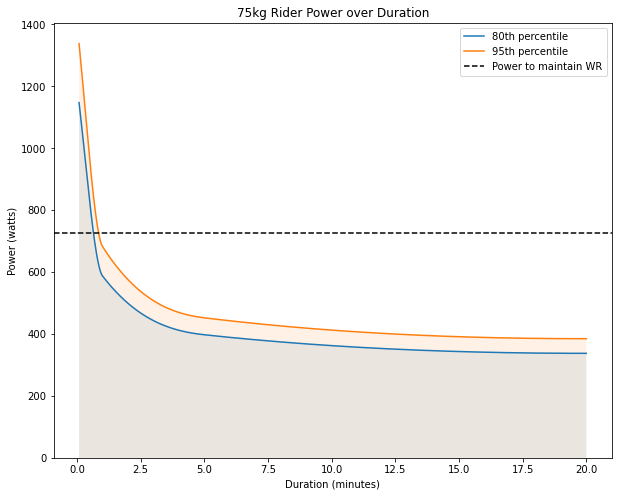
I don’t want to count on a top 5% capable cyclist, so I’ll use a top 20% (or 80th percentile). Every time I refer to a cyclist from here on out, I’ll be referring to an 80th percentile 75kg male cyclist.
The power over duration plot above assumes the cyclist has not accumulated any fatigue, unfortunately that is not the case for a rider attempting to reach 89.5mph. So i’ll come up with a way to account for it.
Accounting for Fatigue
The human factors portion (fatigue) is something I am uneducated about. I am going to take a shot at making a simple model here armed with some experimental data. Here are my assumptions:
- Fatigue will be measured from 0 to 100%. Where 100% is fully fatigued and cannot power the bike anymore.
- Fatigue is cumulative and does not diminish over the ride.
- Fatigue is a function of power and duration.
I’ll define the fatigue \(F\) function of power \(P\) and duration \(T\).
$$F=\frac{PT}{PT_{max}}$$
Which reduces to:
$$F=\frac{T}{T_{max}}$$
Duration \(T_{max}\) comes from the below curve, which is a function of power.
An example of solving for fatigue looks like this:
If a cyclist outputs \(P=1,148\) watts for \(T=1\) second how much Fatigue \(F\) have they developed?
From the above curve, \(T_{max}(1147.5) = 5\) and \(\frac{T}{T_{max}}=\frac{1}{5} = 0.2\) The cyclist is 20% fatigued.
This simplistic fatigue model will prevent me from setting unrealistic energy or power-duration outputs from the cyclist as they accelerate towards the world record.
Back to Accelerating
Armed with this fatigue model, I can build up a record attempt acceleration “run” without exceeding the capabilities of a cyclist.
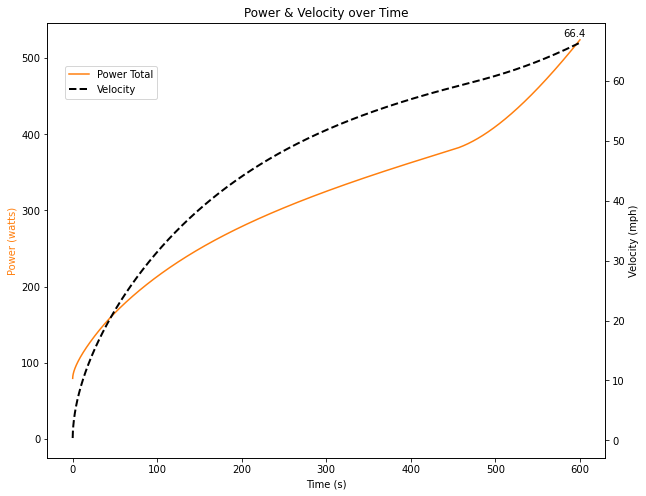
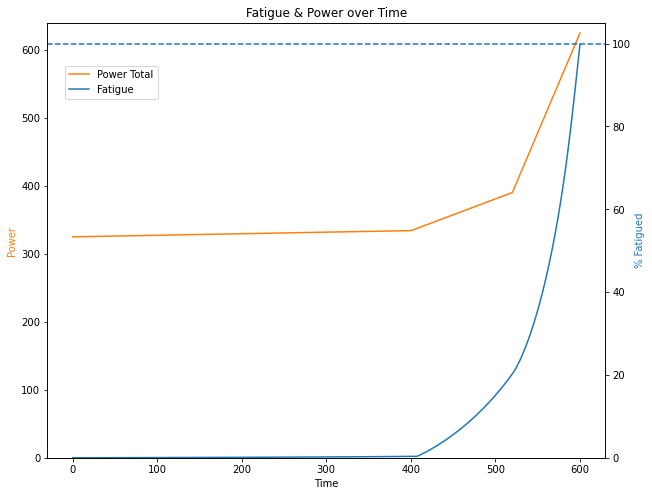
Here is an example in which the cyclist maintains a power output (orange) curve over a 600 second acceleration run. Note that fatigue (blue) does not exceed 100%.

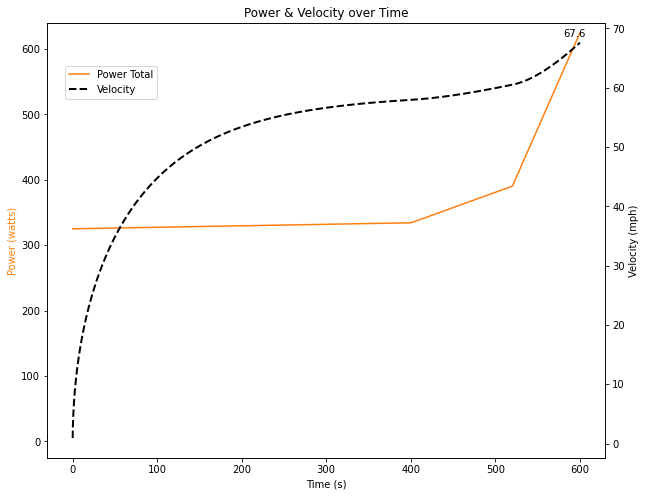
So would this attempt accelerate the cyclist to 100 mph? No. This effort only accelerates the cyclist to 66.4 mph before the rider is fully fatigued. See below, where I have added velocity to the plot.
Does the buck stop here? Is our cyclist doomed to only ever reach 66.4 mph?
No, but it does showcase the importance of acceleration and managing fatigue. Up until now, I had not shown quantitatively just how fatiguing the ride up to high speed would be.
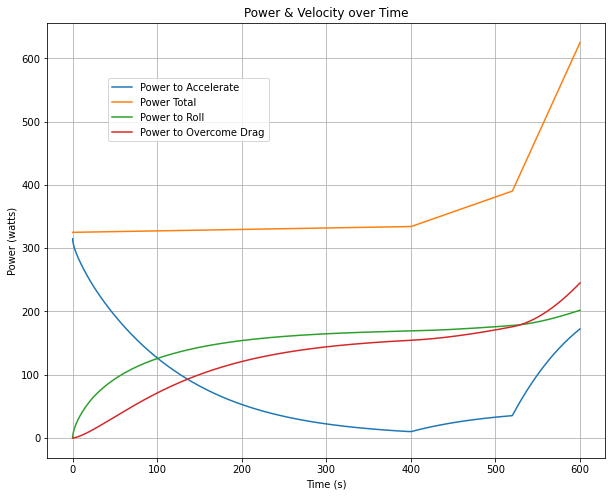
Another interesting plot to look at over the run is what the cyclist power is doing over time. For instance, the cyclist may primarily be overcoming drag or rolling resistance for a large duration of the run. If they’re not accelerating they are accumulating fatigue for no benefit.
Given the power and velocity curves from the run above, here is what that power would be doing at each moment in time:
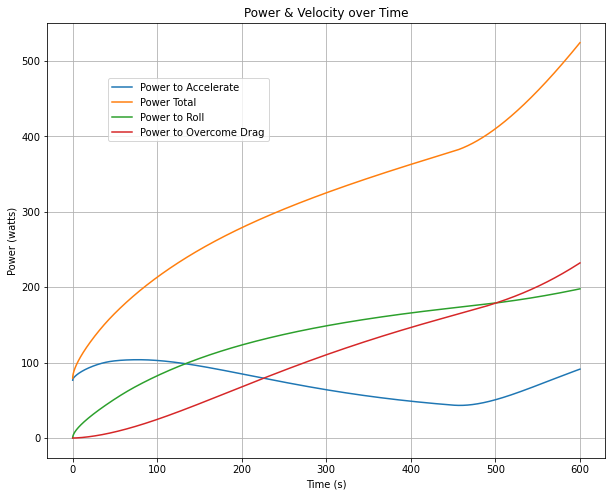
Notice that most of the power at the beginning of the run is accelerating the cyclist. As their velocity increases, so do aerodynamic drag and rolling resistance, and the accelerating power drops. There must be an optimal way, given all vehicle and cyclist dependent parameters (weight, drag coefficient, fatigue curve, etc.) to accelerate to a maximum speed before fully fatigued.
For instance, this power and fatigue curve:
Results in a greater final speed:
And is therefore a more efficient way to output power over the duration of an attempt:
Summary
Without casting this as an optimization problem and programmatically searching for the optimal run, A maximum speed of 67.6 mph is achievable. This is despite the fact that this cyclist/vehicle combination could easily maintain 100 mph (for a few seconds) as found in the last post.
Accounting for fatigue during acceleration is a major factor in finding maximum speed achievable.
In the next post I hope to wrap up some of the theory on all of this and state a comprehensive list of variables to address that would allow a cyclist to reach high speed.