In the last two posts I went over what it takes to go fast on your own power. I found that its possible to maintain world-record breaking speeds for a fit cyclist in the right vehicle, but accelerating to those speeds is nearly impossible in current vehicles unless you are a top level cyclist.
In this post I will cover what really matters in a vehicle design to try and reach high speed under human power.
Starting With the Math
If I start with the equations that govern power to go fast, I can find what variables matter the most. The design effort can go towards getting those variables to values that will ensure the bike can go fast… in theory.
The power to go forward is equal to:
$$P_{total} = \frac{P_{R}+P_{D}+P_{A}}{\eta}$$
Which is the same as:
$$P_{total} = \frac{v(mgC_{rr}+\frac{1}{2}\rho v^{2}AC_{D}+ma)}{\eta}$$
Definitions for the layman:
| Thing | Variable | Value Range | Units (SI) |
| Mass | \(m\) | 90-150 | \(kg\) |
| Gravity of Earth | \(g\) | 9.81 | \(\frac{m}{s^2}\) |
| Air Density | \(\rho\) | 0.9 – 1.23 | \(\frac{kg}{m^3}\) |
| Vehicle Frontal Area | \(A\) | 0.3 – 0.8 | \(m^2\) |
| Drag Coefficient | \(C_{D}\) | 0.03 – 0.2 | – |
| Coefficient of Rolling Resistance | \(C_{rr}\) | 0.003 – 0.01 | – |
| Drivetrain Efficiency | \(\eta\) | 0.9 – 1.0 | – |
| Velocity | \(v\) | 0 – 50 | \(\frac{m}{s}\) |
| Power to Roll | \(P_{R}\) | – | \(w\) |
| Power to Overcome Drag | \(P_{D}\) | – | \(w\) |
| Power to Accelerate | \(P_{A}\) | – | \(w\) |
I’ve thrown in some reasonable value ranges in the table above to give a frame of reference.
Looking again at what we’re trying to minimize to go fast:
$$P_{total} = \frac{v(mgC_{rr}+\frac{1}{2}\rho v^{2}AC_{D}+ma)}{\eta}$$
I’ll pick apart each variable above and discuss how important it is, and what can be done in the design to minimize it.
Velocity \(v\)
Unfortunately velocity is the thing I’m trying to maximize and it appears in the numerator of each term. Sometimes multiple times like for \(P_{A}\). The goal is to go fast, \(v\) is going to be high and that is going to mean lots of power.
Mass \(m\)
Mass appears in both the power to roll \(P_{R}\) and the power to accelerate \(P_{A}\). A lighter bike will accelerate more quickly and roll faster for the same power. Mass has an obvious lower limit, the weight of the rider, but a mass-less vehicle is not feasible. Fortunately it will be obvious if the vehicle or rider is stacking on pounds like a college freshman. A competitive design is likely to have a full carbon fairing and either an aluminum, carbon or fiberglass structure beneath. All very light materials. In any case mass matters, but much of it will come from the rider. If the rider is fit, increases in mass correlate to increases in power output. I’ll keep mass in mind, but I wont be a complete weight weenie.
Acceleration due to Gravity \(g\)
These tests will be performed on Earth unless Elon invites me to go to Mars. Mars’ gravitational pull is 38% of that of Earth. \(3.72 \frac{m}{s^2}\). I’ll be bold and assume Elon wont ask. Acceleration due to gravity in this case will be \(9.81 \frac{m}{s^2}\).
Coefficient of Rolling Resistance \(C_{rr}\)
I talked a bit about \(C_{rr}\) in the last post. It increases with velocity like this:
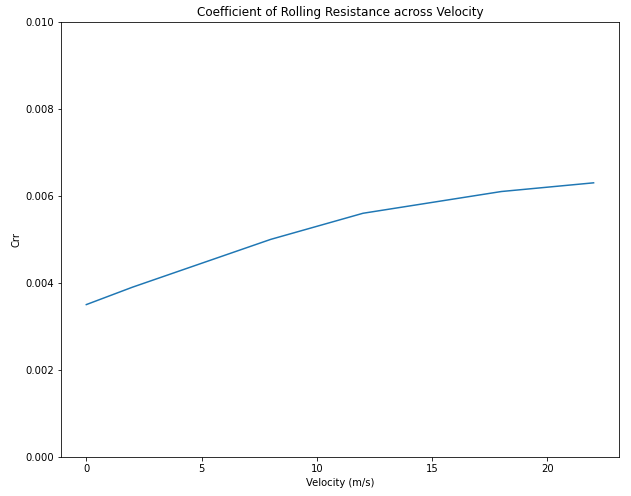
I haven’t found any experimental data beyond 20 m/s (45 mph). I will assume it continues to increase with velocity, and its derivative continues to decrease. The above curve generally assumes that effort is taken to ensure that rolling resistance is minimized. Here is a list of some things to consider:
- Rubber has low energy loss due to deformation (lots of rebound)
- Tire is run tubeless
- Tire has radial ply construction if it can be found
- Tire width is selected following guidance from Bicycling Science
- Tire pressure is high (110+ psi)
- Tire diameter balances drag, structural concerns, weight, and rolling resistance. (rolling resistance decreases with increasing tire diameter).
- Wheels are well aligned
- Bearings are well adjusted
- Tread pattern is minimal
Because there are so many complex factors that impact rolling resistance, I will assume the above curve is achievable but improvements beyond that are not feasible. In other words, the math is fixed here.
Air Density \(\rho\)
Air density only appears in power to overcome aerodynamic drag. Where:
\(P_{D} = \frac{1}{2}\rho v^{3}AC_{D}\)
\(P_{D}\) is positively linearly related to \(\rho\). As air density increases, power to overcome aerodynamic drag increases proportionally. If conditions are hotter, or you ascend in elevation, air density drops. Air shouldn’t be too hot or too thin, or human factors will become an increasing concern (you need to breathe, and you need to stay cool).
The density of air in a standard atmosphere at sea level is \(1.225 \frac{kg}{m^3}\). Here is a table showing air density at increasing altitude:
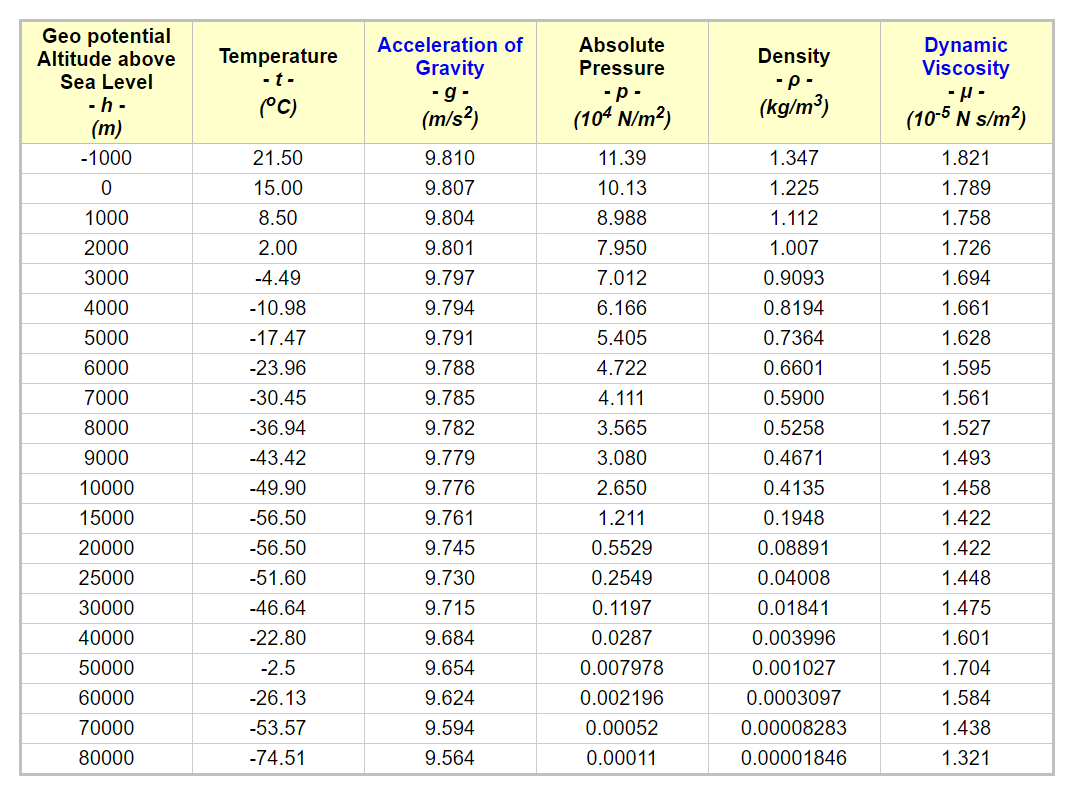
Taken from Engineering Toolbox
Ideally, the cyclist breathes high density air and cycles the vehicle in a vacuum, but that is not feasible. Many Human Powered Vehicle records are set at 4,511 ft (1,375 m). At that altitude, on a 75 degree day, air density is almost exactly \(1 \frac{kg}{m^3}\). This is a 25% reduction in air density, which corresponds to a 25% reduction in power to overcome aerodynamic drag. The design cannot change the air density, but I can count on lower air density at 4,511 ft altitude on a warm day.
Frontal Area \(A\)
Frontal area only appears in power to overcome aerodynamic drag. Where:
\(P_{D} = \frac{1}{2}\rho v^{3}AC_{D}\)
\(P_{D}\) is positively linearly related to \(A\). As frontal area increases, power to overcome aerodynamic drag increases proportionally. This parameter is critically important at higher speeds when aerodynamic drag begins to dominate the power required. Frontal area has a minimum set by human factors. The cyclist must be able to freely cycle within the vehicle, which requires some room for knees, legs, and feet to be circling around. The vehicle must also house wheels, a seat, steering mechanism, etc. A recumbent cyclist like the one below can squeeze into a very small frontal area with some careful design choices.
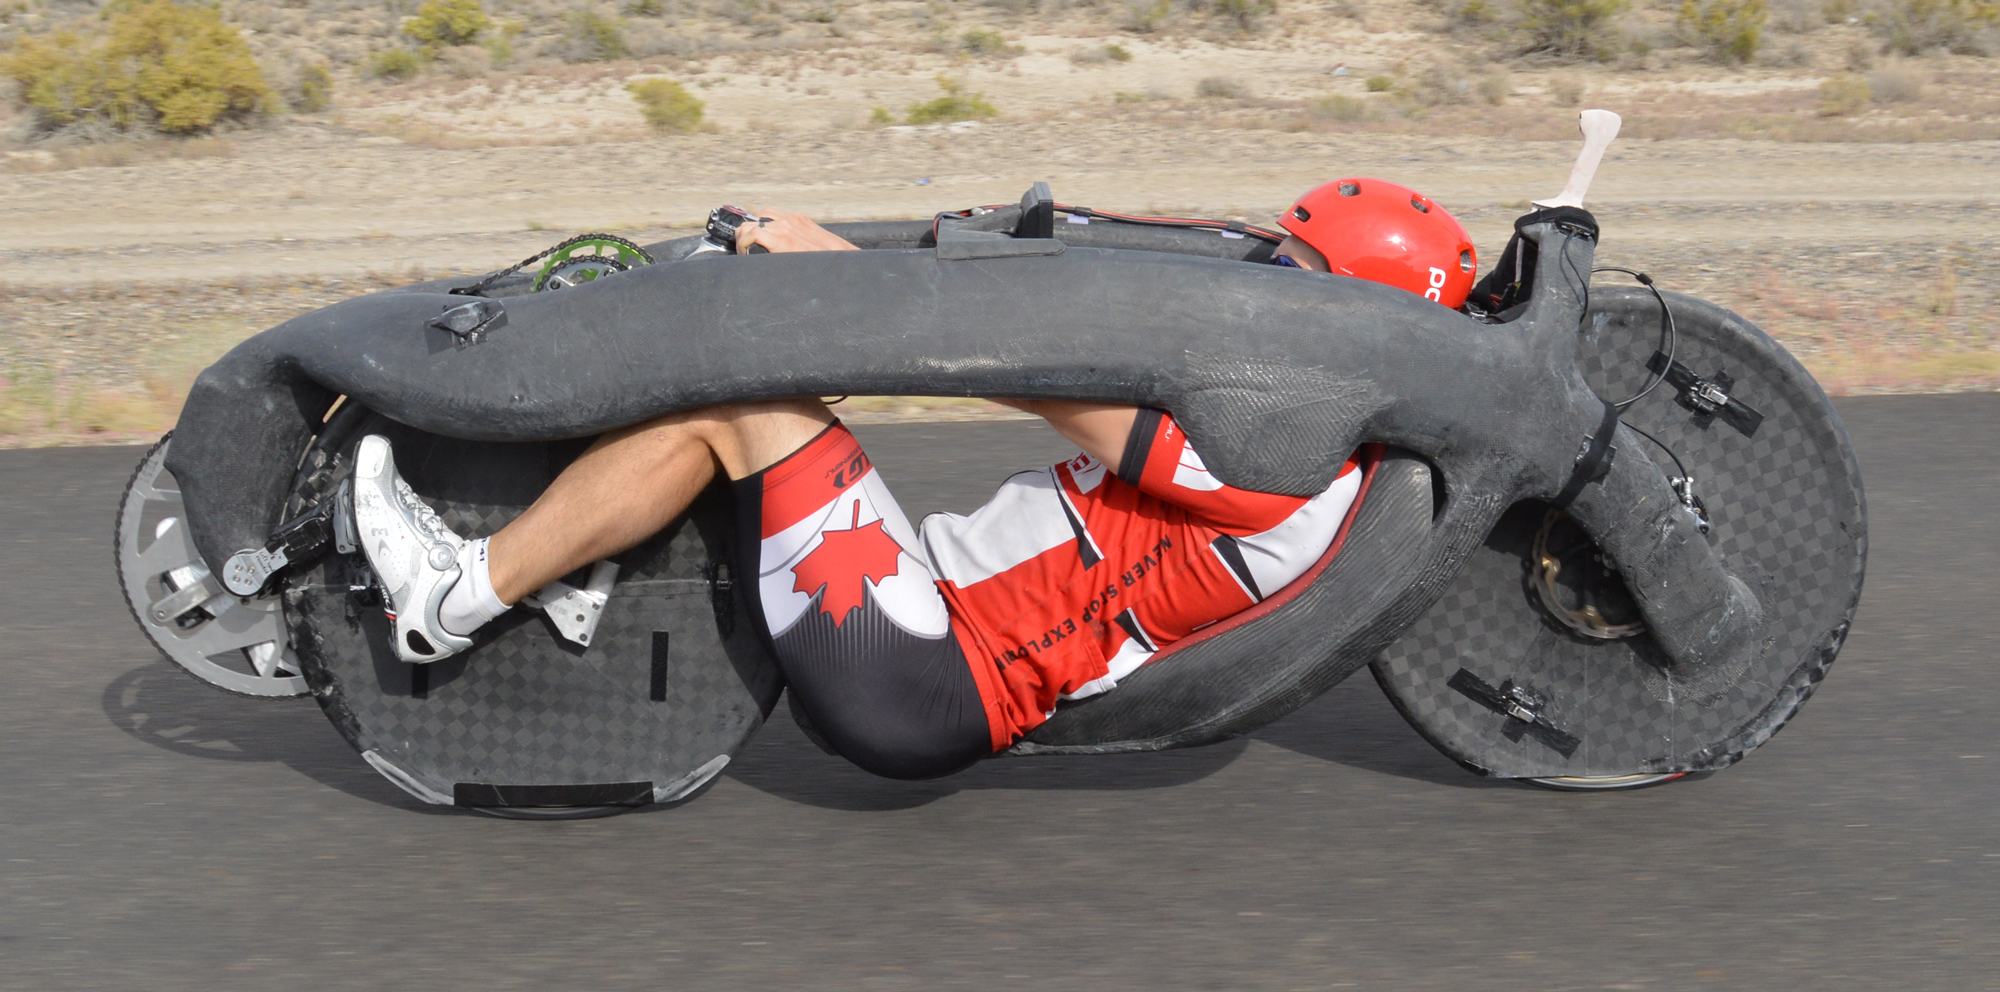
Taken from http://www.aerovelo.com/
The design of the vehicle will minimize frontal area primarily by ensuring a riding posture that minimizes the area of the vehicle perpendicular to the wind.
Drag Coefficient \(C_{D}\)
Drag Coefficient only appears in power to overcome aerodynamic drag. Where:
\(P_{D} = \frac{1}{2}\rho v^{3}AC_{D}\)
\(P_{D}\) is positively linearly related to \(C_{D}\). As drag coefficient increases, power to overcome aerodynamic drag increases proportionally. This parameter is critically important at higher speeds when aerodynamic drag begins to dominate the power required.
Drag coefficient is determined by the exterior shape of the vehicle. Given a fixed frontal area, different shapes will result in different drag coefficients. The best published drag coefficient for a velomobile I have seen is 0.0383. Practical velomobiles can have drag coefficients upwards of 0.2, over 5 times as much. Needless to say, this variable is of critical importance. A large part of vehicle design effort should go towards ensuring the shape of the vehicle is conducive to a very low drag coefficient.
Drivetrain Efficiency \(\eta\)
Drivetrain efficiency appears in the \(P_{total}\) equation in the denominator. It represents the proportion of the input power from the cyclist that propels the vehicle forward. What else might it go to? Some power is lost spinning sprockets or gears around. Some is lost pulling a chain around in a loop. Some is lost flexing tires, spokes, crank arms, and a frame.
Drivetrain efficiency can be maximized by:
- Cleaning and lubricating the drivetrain.
- Removing all unnecessary sprockets, chain tensioniers, and idlers.
- Using large sprockets.
- Using stiff materials in the drivetrain, like carbon fiber.
I will assume that the drivetrain efficiency is fixed at 97%. From a design perspective, this requires that the design focuses heavily on minimizing drivetrain friction and complexity.
The After Math
Before I started diving into the variables, I said:
If I start with the equations that govern power to go fast, I can find what variables matter the most. The design effort can go towards getting those variables to values that will ensure the bike can go fast… in theory.
Those most critical variables are:
- Drag Coefficient \(C_{D}\)
- Frontal Area \(A\)
- Coefficient of Rolling Resistance \(C_{rr}\)
While the other variables obviously matter, a design that really minimizes these will have a shot at going fast. How do you minimize these though?
For \(C_{rr}\) addressing the points above in the math section are your best bet.
For \(A\), make the vehicle as small as physically possible without overly restricting the cyclists movement such that the size reduction isn’t worth further reductions in cyclists ability to output power.
\(C_{D}\) can be made increasingly low by choosing a vehicle shape that is conducive to minimizing drag. What is drag?
Straight Back to Math
The drag equation is:
\(F_{D} = \frac{1}{2}\rho v^{2}AC_{D}\)
Which is the same as:
\(C_{D} = \frac{F_{D}}{.5\rho v^{2}AC_{D}}\)
Should look pretty familiar. Multiply that by \(v\) and you get \(P_{D}\). Drag coefficient is minimized by eliminating the drag forces that push the vehicle back when you want to go forward. Those drag forces can be split into parts:
- Lift-Induced Drag
- Parasitic Drag
- Form Drag
- Skin Friction Drag
Lift induced drag is minimized by ensuring that the vehicle generates no lift. Form and skin friction drag are tougher.
Form Drag
Form drag is minimized by choosing streamlined over blunt shapes, maintaining laminar flow for as long as possible, ensuring that flow does not separate from the vehicle, and avoiding large detached vorticies. Easy peasy.
Skin Friction Drag
Skin friction drag comes from the interaction of a fluid (like air) with the surface of the vehicle. The more surface, the more interaction. The rougher the surface, the more interaction. The goal here is to minimize the amount of interaction between the air and the surface. That is not the whole picture, but the whole picture is pretty complicated.
Please Say Something Concrete about Design
Here is a pretty shape:
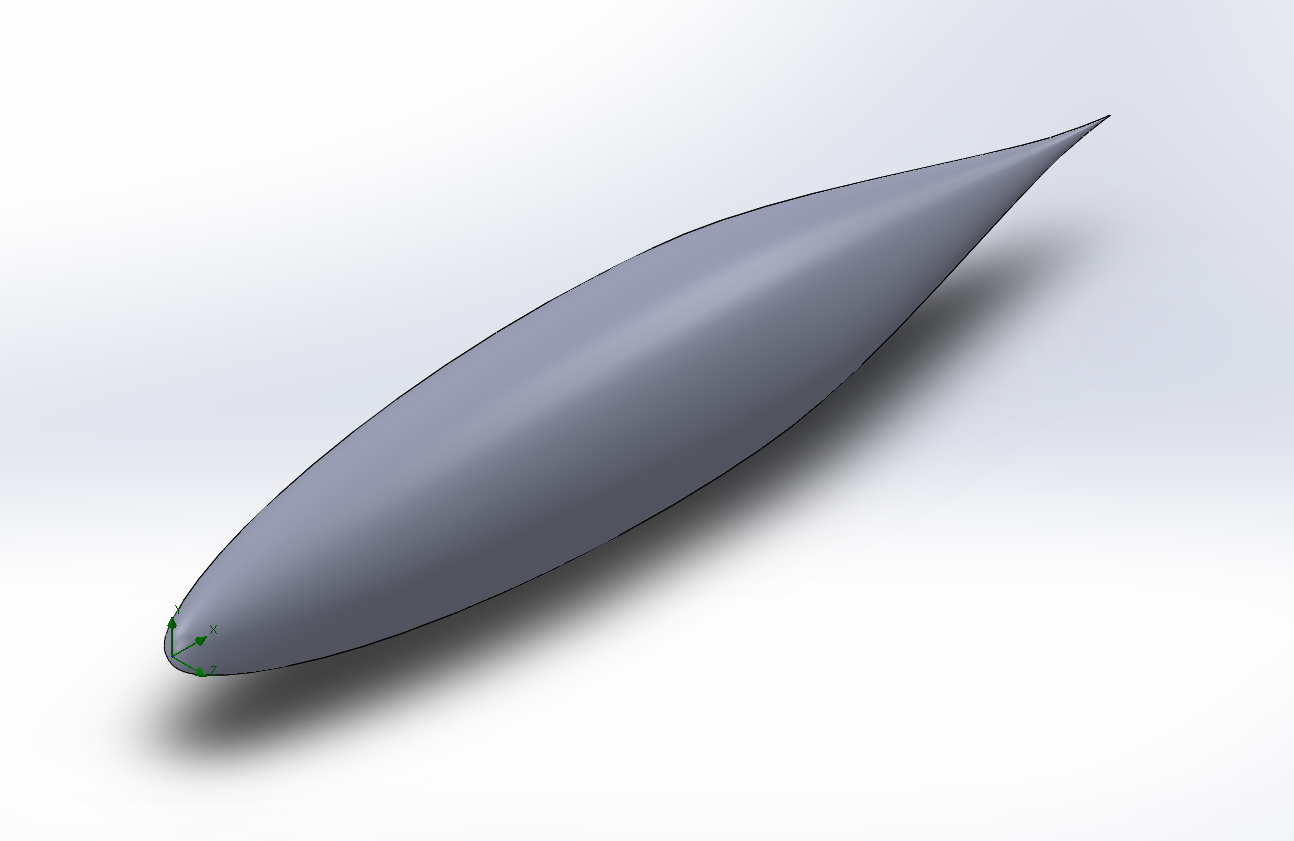
This is a NACA 663018 symmetric airfoil spun around 180 degrees to make a streamlined bullet-like shape. This one in particular is just over 2 feet wide and 11.5 feet long. Here are dimensions (in inches).
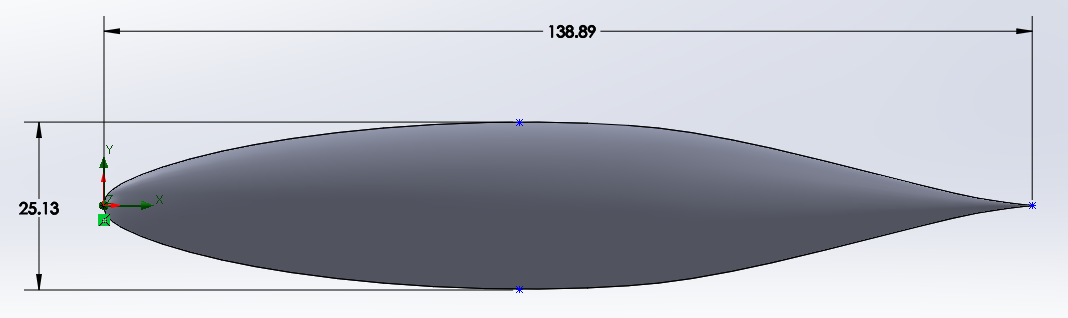
With some careful structure within, it could possibly fit 2 small (5’10” or less) cyclists within. It has a lot of characteristics that one might look for when seeking a low drag coefficient. How low?
CFD Simulation
To find out how low the drag coefficient is, do a CFD simulation. CFD (Computational Fluid Dynamics) numerically approximates the characteristics of a fluid flow in and/or around a body. In this application, it will be useful to approximate how hard it is to move this particular solid through the air at a speed that would break the human powered vehicle speed record on land (90 mph).
Performing a simulation that says the air meets the vehicle head on at 90 mph at a temperature of 70 F and an absolute pressure of 84,395 Pa corresponding to an air density of 1 \(\frac{kg}{m^{3}}\), we get about 700 watts of power to make the vehicle maintain speed (corresponding to a force of 17 newtons with a velocity of 90 mph). This is a drag coefficient of \(C_{D} = 0.066\).
This is very likely to be a liberal estimate of the real power required to overcome aerodynamic drag at such speed in real life. Why? In real life, the flow characteristics will not be so uniform, the vehicle will have protruding wheels, an imperfect surface finish, possibly some protrusions for a forward facing camera, or body panels fitting together.
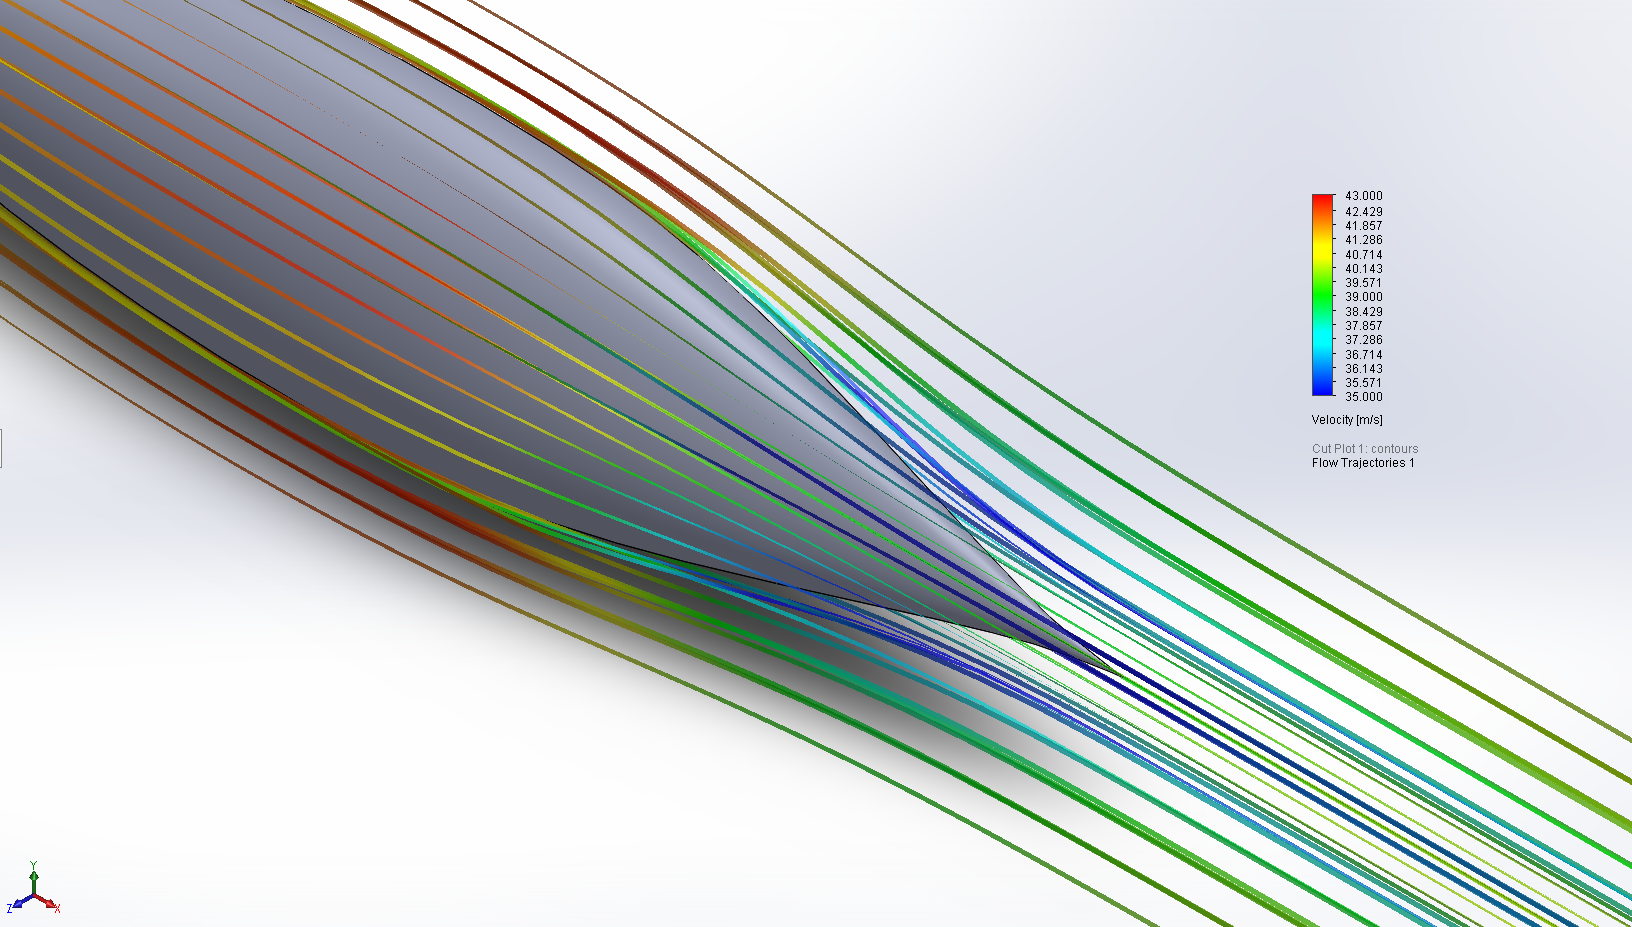
Here are some nice visualizations of the CFD analysis:
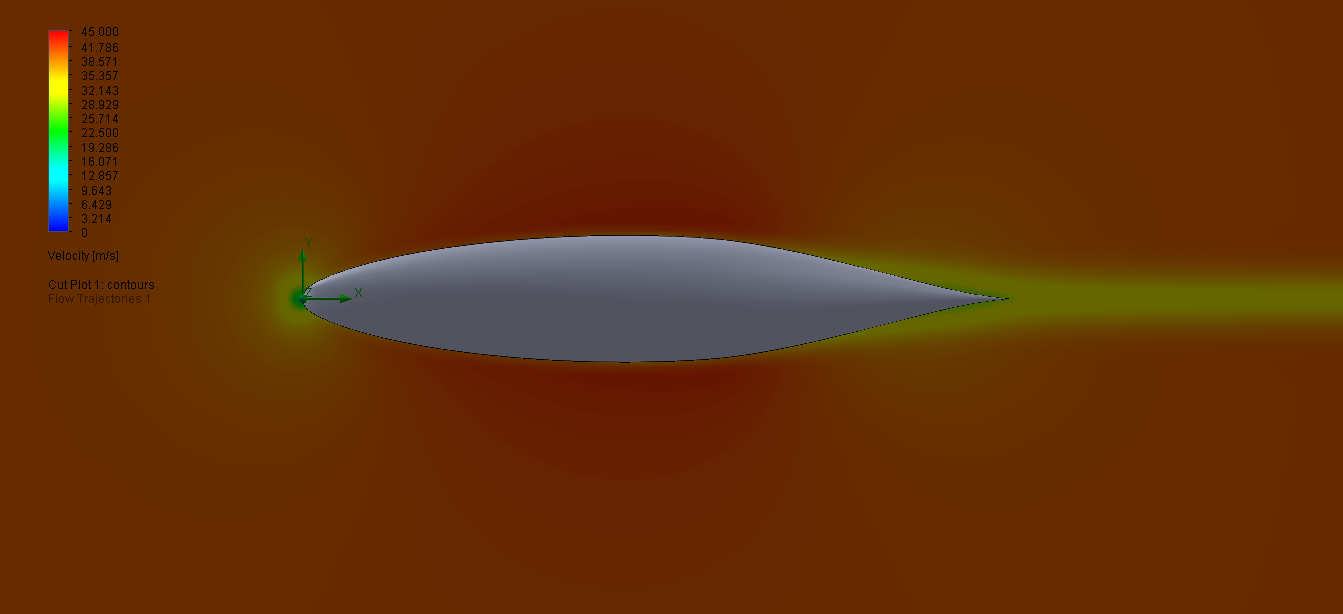
Above showing velocity of the flow along the longitudinal axis of the vehicle.
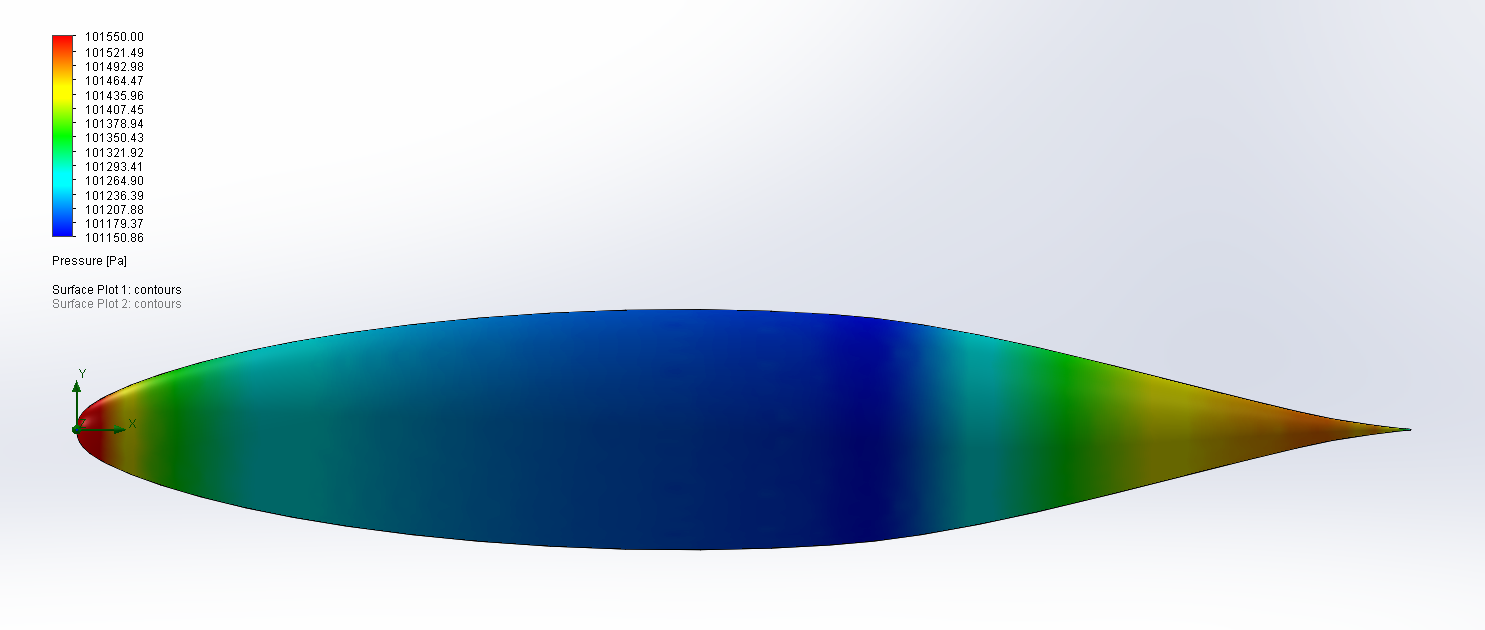
Above showing static pressure on the surface of the vehicle.
Above showing streamlines over time colored by velocity.
Note the lack of vorticies shedding from the vehicle.
A 6 series symmetric NACA airfoil may be well suited for the shape of the velomobile. The airfoil is designed in such a way to maximize laminar flow for as long as possible, and if made smooth, I am suggesting here that a teardrop shape made by rotating the foil 180 degrees into a volume will exhibit the same characteristics.
Summary
Designing a human powered vehicle to go fast on land is hard. There is a lot to consider. I have scratched the surface of preliminary design in the last few posts, and gave some concrete bullets to address in this one. I have left out many details like mechanical design, structure, stability and control, etc. These may become increasingly vehicle-specific, however some high level preliminary design could be useful. If I do dive into those details, you’ll be the first to know.